Python 滚动回归
本文实现了多个资产分别在时间序列上进行滚动回归,并返回由最新系数计算得到的残差,最后将多个资产的残差结果重新聚合为多重索引的数据框。
代码示例
导入包
Python
import pandas as pd
from statsmodels.regression.rolling import RollingOLS
from statsmodels.tools import add_constant
from tqdm import tqdm

# 在 apply 时展示进度条
tqdm.pandas()
查看原始数据
Python
data = pd.read_pickle("./demo.pkl")
# 取 3 只股票,减少计算时间
data = data.loc[(slice(None), ["000001.SZ", "000002.SZ", "000008.SZ"]), :]

滚动回归的核心函数
Python
def rolling_ols(x, y, window=120, _add_constant=True):
    try:
        # 为自变量添加截距项
        if _add_constant:
            x = add_constant(x)
        # 构建滚动回归模型
        model = RollingOLS(endog=y, exog=x, window=window)
        # 估计滚动回归的参数,包括截距项和各特征的回归系数
        params = model.fit().params
        # 根据估计出的参数,计算估计出的因变量值
        y_hat = (params * x).sum(axis=1)
        # 计算残差
        residual = y - y_hat
        return pd.DataFrame({"residual": residual})
    # 如果报错,则可能是样本量比 window 小,无法进行回归
    except:
        return None
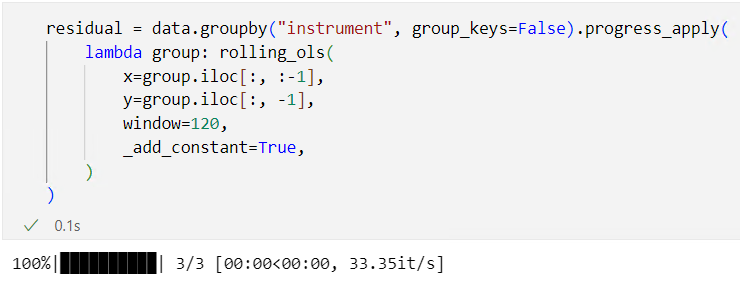
groupby后apply
使用 progress_apply 可以展示进度条。
Python
residual = data.groupby("instrument", group_keys=False).progress_apply(
    lambda group: rolling_ols(
        x=group.iloc[:, :-1],
        y=group.iloc[:, -1],
        window=120,
        _add_constant=True,
    )
)
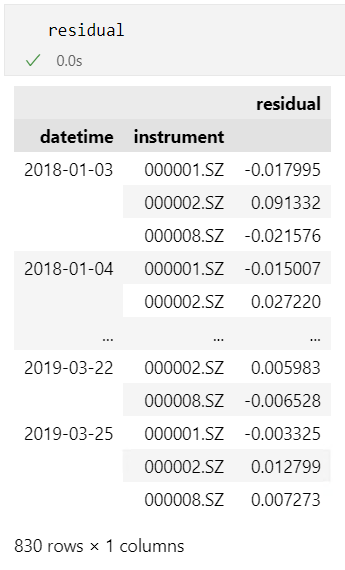
查看结果