R 语言
调试
在终端中运行一个命令后报错,可以再运行
或者
即可查看具体的报错位置。
清空控制台 Console
按下Ctrl+L 快捷键,可以清空控制台并显示一个新的提示符。
清空控制台不会影响已经加载的变量和函数,只是清空了控制台的显示。
导出数据框为 CSV 文件
手动实现类似 Python 的enumerate功能
转换为 R 语言:
面向对象编程
S3
以 BH Procedure 进行多重假设检验为例:先创建一个泛型函数(可以理解为一个类),再定义泛型函数的方法。
# 创建 bh 法的泛型函数
bh <- function() {
    UseMethod("bh")
}

# 定义 bh.func
bh.func <- function(pv, alpha = 0.05) {
    m <- length(pv)
    i <- 1:m
    # 将 p 值从小到大排序
    sorted_pv <- sort(pv)
    # 如果最小的 p 值都大于 alpha / m,则拒绝域为空,直接返回 0 向量
    if (sorted_pv[1] > alpha / m) {
        return(rep(0, m))
    }
    # 找到满足 pvalue <= i/m * alpha 的最大的 i
    k <- max(i[sorted_pv <= i / m * alpha])
    # k 对应的 p 值即为拒绝域的边界
    criterion <- sorted_pv[k]
    # 将 p 值中最小的 k 个值的位置设为 1,其他位置设为 0,并返回
    return(1 * (pv <= criterion))
}
R6
library(R6)

# 创建一个R6类
Person <- R6Class("Person",
  public = list(
    name = NULL,
    age = NULL,
    initialize = function(name, age){
      self$name <- name
      self$age <- age
    },
    get_info = function(){
      paste("Name:", self$name, "\nAge:", self$age)
    }
  )
)

# 创建一个Person对象
person1 <- Person$new("Alice", 30)

# 调用方法
print(person1$get_info())
查看数据类型
在 R 语言中,可以使用以下函数来查看数据类型:
class(x):用于显示 x 对象的数据类型(类),返回一个字符类型的值。typeof(x):用于显示 x 对象的数据类型(基础类型),返回一个字符类型的值。str(x):用于显示 x 对象的结构信息,包括各成分的名称、类型、长度和前几个元素的值。
举个例子,如果要查看一个变量 a 的数据类型,可以使用以下代码:
# 创建一个整型变量a
a <- 10

# 使用class()函数查看变量a的数据类型
class(a)

# 使用typeof()函数查看变量a的基础数据类型
typeof(a)

# 使用str()函数查看变量a的结构信息
str(a)
输出结果如下:
这表明变量 a 的数据类型为 numeric(数字类型),基础数据类型为 double,它只有一个值,且值为 10。
格式化输出
输出一个字符串,固定长度为 20,如果字符串的长度不足 20 的话,就将字符串居中后在两端补上井号(padding)。
这在 Python 中可以用
在 R 中,可以用

同时输出字符串和变量
变量是标量
如果变量是标量,可以使用 paste() 或者 paste0() 函数来将文本和变量组合在一起,并使用 print() 函数来输出结果。
-
paste()函数将多个输入对象连接在一起,并返回一个字符向量。 -
paste0()函数与paste()函数类似,但是不会在不同对象之间添加空格或其他分隔符。
以下是使用 paste() 函数的示例:
输出:
以下是使用 paste0() 函数的示例:
输出:
如果您需要在文本和变量之间添加其他分隔符,例如逗号或冒号,只需将它们放在 paste() 或 paste0() 函数的引号中即可,例如:
输出:
变量是向量
如果变量是向量,那么用 paste 会将字符串输出很多遍。
参考:https://stackoverflow.com/a/28866585/
注意 cat 函数只适合向屏幕打印值,并不会返回值
Also important to note that cat is really only good for displaying output to the user; the function only ever returns NULL invisibly. If you want to capture the result, you'll need to use paste.
Here's how to capture the result for this scenario: result <- paste(c("The first three notes are: ", notes,"\n"),collapse="\t").
循环进度条
library(progress)

pb <- progress_bar$new(total = 100, clear = FALSE)
for (i in 1:100) {
  pb$tick()
  Sys.sleep(1 / 100)
}
参考:https://www.jianshu.com/p/efc3c7394e1f
设置每行代码的建议长度
默认每行代码的建议长度是 80 个字符,如果超出则会有蓝色波浪线进行提示。
在项目文件夹新建一个 .lintr 文本文件,写入:
即可将每行代码的建议长度改为 200 个字符,将蓝色波浪线消除。
参考:https://stackoverflow.com/a/67822867/
R Markdown 渲染为 PDF 文档
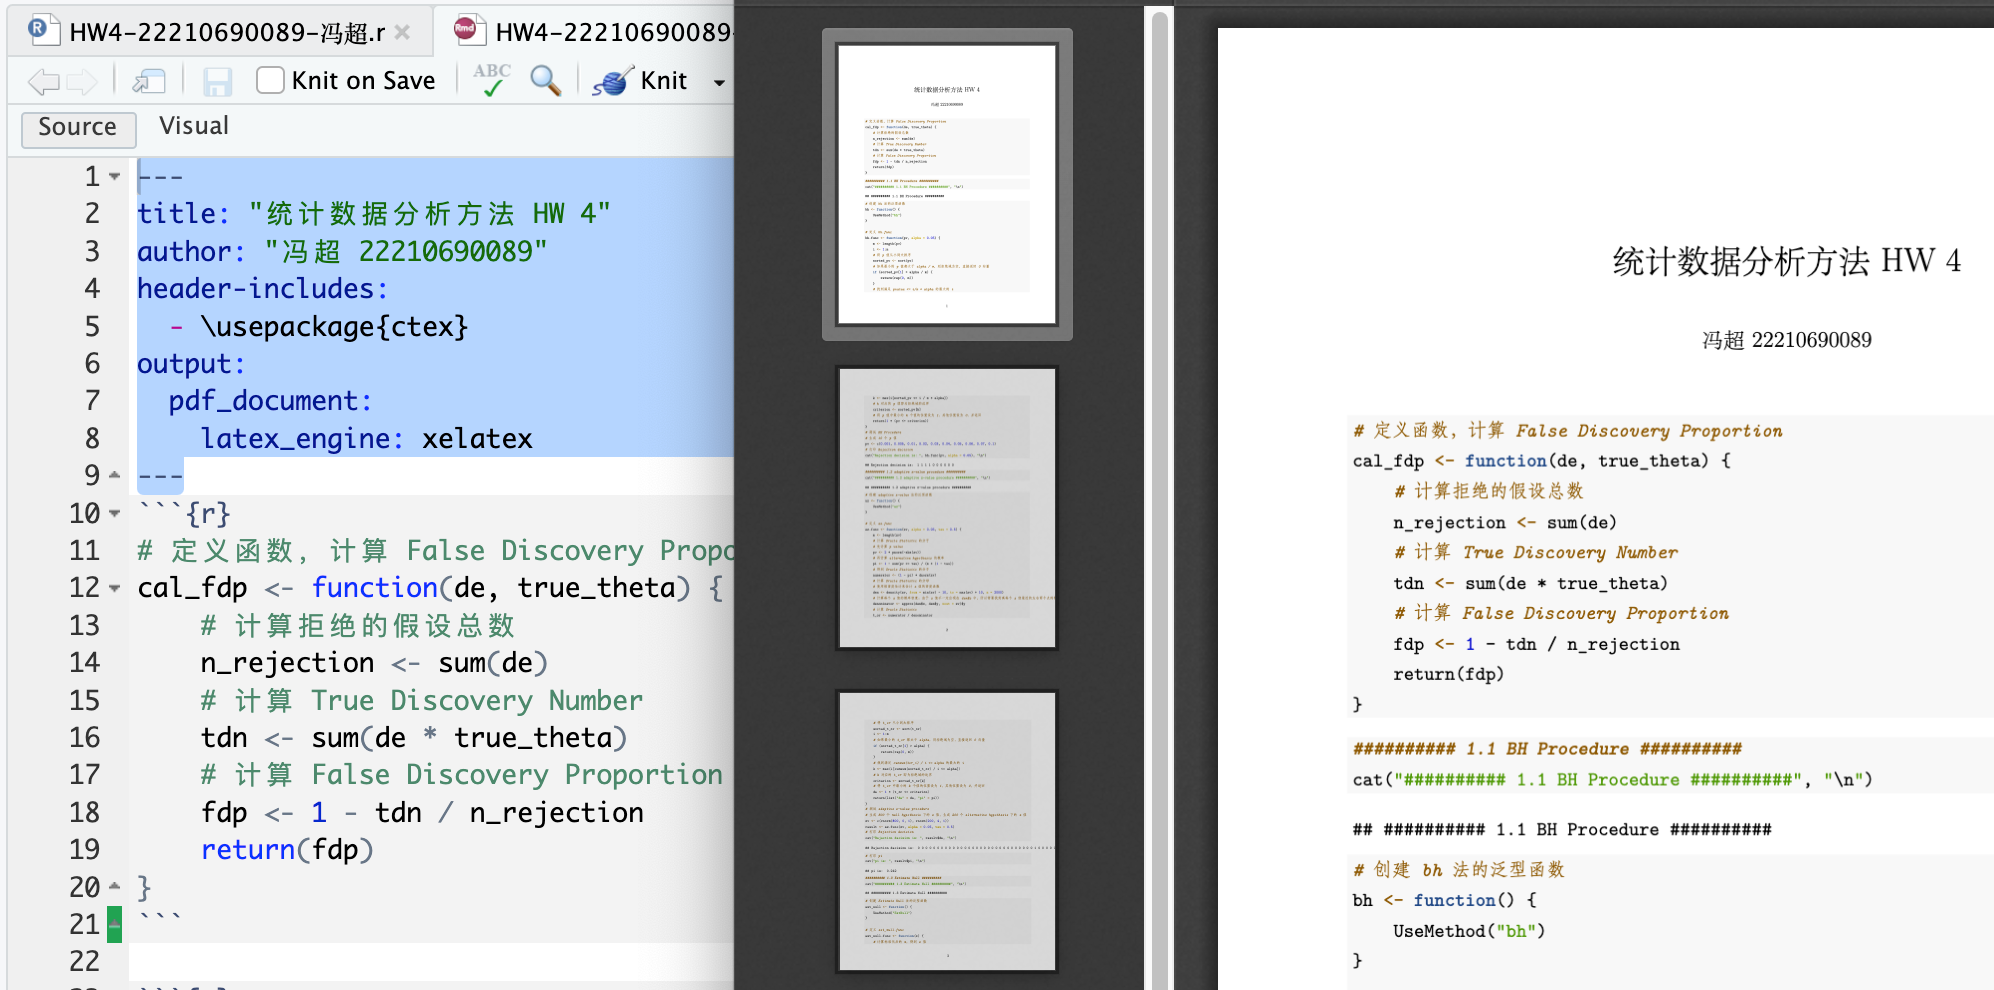
渲染带有中文的 PDF 文档
参考:http://yufree.github.io/blog/2014/07/21/rmd-to-pdf.html
---
title: "中文标题"
author: "Jeremy Feng"
header-includes:
  - \usepackage{ctex}
output:
  pdf_document:
    latex_engine: xelatex
---
不输出图片标题
参考:https://stackoverflow.com/a/42841375/
固定图片位置
参考:https://stackoverflow.com/a/51608212/
多图并排
直接输入 \(\LaTeX\) 命令即可渲染多图并排效果:
\begin{figure}[H]
    \centering
    \begin{minipage}[t]{0.48\textwidth}
        \centering
        \includegraphics[width=1\textwidth]{./image.png}
        \caption{标题 1}\label{标题 1}
    \end{minipage}
    \begin{minipage}[t]{0.48\textwidth}
        \centering
        \includegraphics[width=1\textwidth]{./image.png}
        \caption{标题 2}\label{标题 2}
    \end{minipage}
\end{figure}
代码换行
---
title: "My Title"
header-includes:
  - \usepackage{ctex}
output:
  pdf_document:
    latex_engine: xelatex
    pandoc_args: --listings
    includes:
      in_header: listings-settings.tex
---
在 listings-settings.tex 中设置:
参考:https://d.cosx.org/d/422430-r-markdown
代码换行后,会破坏原有的代码高亮样式。要想自定义高亮样式,可以在 listings-settings.tex 中设置:
\lstset{
  language=,
  basicstyle=\ttfamily,
  keywordstyle=\color{blue}\ttfamily,
  stringstyle=\color{red}\ttfamily,
  commentstyle=\color{green!60!black}\ttfamily,
  showstringspaces=false,
  keepspaces=true,
  columns=flexible,
  numbers=left,
  numberstyle=\scriptsize\color{gray},
  breaklines=true,
  breakatwhitespace=true,
  tabsize=4,
  frame=single,
  framerule=0pt,
  morekeywords={},
  escapeinside={(*@}{@*)}
}
保留 tex 文件
默认会在渲染完 PDF 后将 tex 文件删除,若要保留,可以用:
---
title: "My Title"
header-includes:
  - \usepackage{ctex}
output:
  pdf_document:
    keep_tex: true
    latex_engine: xelatex
---
表格标题
直接在表格下面添加一行:
例如:
| First Header  | Second Header | Third Header         |
| :------------ | :-----------: | -------------------: |
| First row     | Data          | Very long data entry |
| Second row    | **Cell**      | *Cell*               |
| Third row     | Cell that spans across two columns  ||

Table: Your Caption
参考:https://stackoverflow.com/a/33965888/
输出目录
公式环境内部带有中文
参考:https://tex.stackexchange.com/a/199423
指定页边距
例如,要指定宽度为 2cm 的边距,可以包含以下内容:
---
title: "Habits"
author: John Doe
date: March 22, 2005
geometry: margin=2cm
output: pdf_document
---
对于要传递给 LaTeX 的 geometry 包的更复杂的规格,可以像 LaTeX 一样将字符串选项串联起来:
---
title: "Habits"
author: John Doe
date: March 22, 2005
geometry: "left=3cm,right=3cm,top=2cm,bottom=2cm"
output: pdf_document
---
参考:https://stackoverflow.com/a/13516042/
指定字号
超链接颜色
ref
首先,在你想要引用的位置给目标对象(例如图表、章节或表格)添加一个标签。你可以使用 \label{} 来创建标签。例如,如果你想在图表处添加一个标签,可以在该位置添加以下代码:
然后,在文档的其他位置引用该标签。你可以使用 \ref{} 来引用标签。例如,要引用名为"myfigure"的图表,可以使用以下代码: