Plot 绘图
matplotlib 支持中文
import matplotlib.pyplot as plt

plt.rcParams["font.sans-serif"] = ["SimHei"]
plt.rcParams["axes.unicode_minus"] = False
显示所有可用的字体
from matplotlib.font_manager import FontManager

fm = FontManager()
mat_fonts = set(f.name for f in fm.ttflist)
print(mat_fonts)
查看字体
常用的中文字体:'Kai', 'Kaiti SC', 'Hei', 'SimSong', 'Source Han Serif SC'
{'System Font', 'Noto Sans Limbu', 'Snell Roundhand', 'DejaVu Sans Mono', 'Noto Sans Lepcha', 'Apple Braille', 'Georgia', 'STIXSizeOneSym', 'BiauKai', 'Kohinoor Devanagari', 'Libian SC', 'Noto Serif Myanmar', 'Noto Sans Khojki', 'Noto Sans Tai Viet', 'Damascus', 'Rockwell', 'Noto Sans Old Italic', 'Noto Sans Tirhuta', 'Nadeem', 'Webdings', 'Wingdings', 'Seravek', 'DejaVu Serif Display', 'Noto Sans Vai', '.Aqua Kana', 'Noto Sans Tifinagh', 'Bodoni 72 Oldstyle', 'Noto Sans Old Persian', 'Apple LiSung', 'cmex10', 'HeadLineA', 'BM Hanna 11yrs Old', 'Baskerville', 'Noto Sans Kharoshthi', 'Toppan Bunkyu Gothic', 'Herculanum', 'AppleGothic', 'Savoye LET', '.SF Compact', 'Gurmukhi Sangam MN', 'BM Kirang Haerang', 'Brush Script MT', 'DejaVu Sans Display', 'Devanagari MT', 'Sana', 'PSL Ornanong Pro', 'Papyrus', 'Noto Sans Ol Chiki', 'Noto Sans Buhid', 'Toppan Bunkyu Midashi Mincho', 'Noto Sans Cham', 'Lao Sangam MN', 'Phosphate', 'Arial', 'Noto Sans Inscriptional Parthian', 'Noto Sans Multani', 'BM Hanna Air', 'Zapf Dingbats', 'cmsy10', 'Noto Sans Tagbanwa', 'Kohinoor Bangla', 'Noto Sans Mandaic', 'Bangla MN', 'STIX Two Text', 'Heiti TC', 'Noto Sans Warang Citi', 'Diwan Thuluth', 'Noto Sans Pahawh Hmong', 'Gill Sans', 'Noto Sans Old South Arabian', 'Noto Sans Javanese', 'Hiragino Maru Gothic Pro', 'Klee', 'Noto Sans Sharada', 'Noto Sans Old Hungarian', 'Noto Sans Manichaean', 'Optima', 'STIXIntegralsSm', '.SF Arabic', 'PT Serif Caption', 'DIN Alternate', 'STIXSizeTwoSym', 'Wingdings 2', 'LiHei Pro', 'Bangla Sangam MN', 'Geeza Pro', 'Noto Sans Pau Cin Hau', 'Noto Sans Hanifi Rohingya', 'Helvetica', 'Arial Unicode MS', 'Toppan Bunkyu Midashi Gothic', 'BM Yeonsung', 'Mshtakan', 'Superclarendon', 'Bodoni 72', 'InaiMathi', 'Weibei TC', 'Telugu Sangam MN', 'BiauKaiHK', 'STIXSizeFiveSym', 'Kokonor', 'Noto Sans Buginese', 'Bodoni Ornaments', 'Noto Sans Mongolian', 'Noto Sans Sora Sompeng', 'Noto Sans Miao', 'Devanagari Sangam MN', 'Noto Sans Sundanese', 'Al Tarikh', 'Sinhala MN', 'Kefa', 'Noto Sans Bhaiksuki', 'STIXNonUnicode', 'Apple Symbols', 'Times New Roman', 'Noto Sans Samaritan', '.SF Compact Rounded', 'Yuanti SC', 'New Peninim MT', 'Charter', 'Wingdings 3', 'Palatino', 'Skia', 'Gurmukhi MT', 'Noto Sans Lisu', 'DejaVu Sans', 'Noto Sans Takri', 'Tamil Sangam MN', 'Kai', 'American Typewriter', 'Andale Mono', 'Chalkduster', 'Noto Serif Balinese', 'Noto Sans Thaana', 'Myanmar Sangam MN', 'Noto Sans Lydian', 'Noto Sans Elbasan', '.SF NS Rounded', 'Noto Sans Inscriptional Pahlavi', 'Noto Serif Yezidi', 'Tahoma', 'LiSong Pro', 'Raanana', 'Telugu MN', 'STIX Two Math', '.Keyboard', 'Noto Sans Palmyrene', 'Hiragino Sans CNS', 'DecoType Naskh', 'Noto Sans Gothic', 'Noto Sans Kannada', 'Noto Sans Chakma', 'Times', 'Malayalam MN', 'Sathu', 'Noto Sans Brahmi', 'Noto Sans Ugaritic', 'Al Bayan', 'Apple LiGothic', 'Noto Serif Hmong Nyiakeng', 'Noto Sans Canadian Aboriginal', 'Noto Sans Old Permic', 'Hiragino Mincho ProN', 'BM Hanna Pro', 'Lucida Grande', '.ThonburiUI', 'cmss10', 'STHeiti', 'PCMyungjo', 'Noto Sans Adlam', 'PilGi', 'Noto Sans Cuneiform', 'Noto Sans Old Turkic', 'Noto Sans Tai Le', 'Noto Sans Oriya', 'Lantinghei SC', 'STIXIntegralsUpSm', 'Euphemia UCAS', 'Beirut', 'Gujarati Sangam MN', 'Tsukushi B Round Gothic', 'Ayuthaya', 'Kohinoor Telugu', 'Kohinoor Gujarati', 'Diwan Kufi', 'Gujarati MT', 'Source Han Serif SC', 'Noto Sans Caucasian Albanian', 'Waseem', 'PingFang HK', 'Verdana', 'Copperplate', 'Academy Engraved LET', 'GungSeo', 'Party LET', 'STIXIntegralsD', 'Tamil MN', 'Marion', 'cmb10', 'STIXSizeFourSym', 'Farah', 'Arial Hebrew', 'Corsiva Hebrew', 'Noto Sans Wancho', 'Noto Sans Phoenician', 'Noto Sans Tai Tham', 'Menlo', 'Noto Sans Yi', 'Noto Sans Gunjala Gondi', 'Noto Sans Cypriot', 'Helvetica Neue', 'Noto Sans Mro', 'Athelas', 'Noto Sans Bamum', 'Noto Sans Avestan', 'cmr10', 'Noto Sans Kayah Li', 'Wawati SC', 'Oriya MN', 'HanziPen SC', 'Yuppy SC', 'Arial Narrow', 'Sinhala Sangam MN', 'Noto Sans Rejang', 'Arial Black', 'Galvji', 'Arial Rounded MT Bold', 'Noto Sans Linear B', 'STIXSizeThreeSym', 'Shree Devanagari 714', 'Baghdad', 'Noto Sans Mahajani', 'Mukta Mahee', 'Noto Sans Batak', 'Silom', 'Lao MN', 'Noto Sans Egyptian Hieroglyphs', 'Courier', 'Chalkboard', 'Noto Sans Siddham', 'Futura', 'Noto Sans Syriac', 'STFangsong', 'Noteworthy', 'Kaiti SC', 'Hei', 'Cochin', 'YuMincho', 'cmtt10', 'Avenir Next Condensed', 'Noto Sans Armenian', 'STIXIntegralsUp', 'Kannada Sangam MN', 'Noto Sans Mende Kikakui', 'Symbol', 'Oriya Sangam MN', 'Noto Sans Osage', 'Kannada MN', 'Noto Sans Nabataean', 'Noto Sans Modi', 'Consolas', 'Comic Sans MS', 'DejaVu Serif', '.SF Arabic Rounded', 'Microsoft Sans Serif', 'Noto Sans Carian', 'Tsukushi A Round Gothic', 'Courier New', 'Osaka', 'Xingkai SC', 'AppleMyungjo', 'Noto Sans Osmanya', 'PT Mono', 'Big Caslon', 'Malayalam Sangam MN', 'Noto Sans Psalter Pahlavi', 'SignPainter', 'Noto Sans Meetei Mayek', 'PT Serif', 'Muna', 'Apple Chancery', 'Khmer Sangam MN', 'LingWai TC', 'Didot', 'YuKyokasho Yoko', 'Nanum Myeongjo', 'Trattatello', 'Krungthep', 'Noto Sans Tagalog', 'Marker Felt', 'DIN Condensed', 'Zapfino', 'Hiragino Sans GB', 'Noto Sans Coptic', 'LingWai SC', 'Noto Sans New Tai Lue', 'Hiragino Sans', 'Noto Sans Bassa Vah', 'Gurmukhi MN', 'Songti SC', 'Geneva', 'Noto Sans Newa', 'Impact', 'Baoli SC', 'STIXGeneral', 'Apple SD Gothic Neo', 'Farisi', 'Weibei SC', 'Noto Sans Marchen', 'Noto Sans NKo', 'Myanmar MN', 'Chalkboard SE', 'Iowan Old Style', 'Nanum Gothic', 'Noto Nastaliq Urdu', 'Hoefler Text', 'Bradley Hand', 'Trebuchet MS', 'Wawati TC', 'Avenir', 'Noto Sans Masaram Gondi', 'Noto Sans Glagolitic', 'Hannotate SC', 'Noto Sans PhagsPa', 'Plantagenet Cherokee', 'STIXVariants', 'Toppan Bunkyu Mincho', 'Monaco', 'Noto Sans Hatran', 'Noto Sans Syloti Nagri', 'Yuppy TC', 'YuGothic', 'Bodoni 72 Smallcaps', 'Noto Serif Ahom', 'Noto Sans Saurashtra', '.SF NS Mono', 'Mishafi', 'Thonburi', 'Kailasa', 'Nanum Brush Script', '.New York', 'Luminari', 'Khmer MN', 'Noto Sans Meroitic', 'PT Sans', 'KufiStandardGK', 'Noto Sans Lycian', 'Mishafi Gold', 'Al Nile', 'Noto Sans Duployan', 'Noto Sans Kaithi', 'cmmi10', 'BM Dohyeon', 'SimSong', 'ITF Devanagari', 'Noto Sans Hanunoo', 'Noto Sans Myanmar', 'BM Jua', 'Noto Sans Imperial Aramaic', 'Noto Sans Linear A', 'STIXIntegralsUpD', 'Sukhumvit Set', 'Avenir Next', 'Noto Sans Old North Arabian', 'Noto Sans Khudawadi'}
import matplotlib.font_manager
from IPython.core.display import HTML


def make_html(fontname):
    return "<p>{font}: <span style='font-family:{font}; font-size: 24px;'>{font}</p>".format(
        font=fontname
    )


code = "\n".join(
    [
        make_html(font)
        for font in sorted(
            set([f.name for f in matplotlib.font_manager.fontManager.ttflist])
        )
    ]
)

HTML("<div style='column-count: 2;'>{}</div>".format(code))
matplotlib.markers
| marker | symbol | description |
|---|---|---|
"." |
 |
point |
"," |
 |
pixel |
"o" |
 |
circle |
"v" |
 |
triangle_down |
"^" |
 |
triangle_up |
"<" |
 |
triangle_left |
">" |
 |
triangle_right |
更多样式可参考:https://matplotlib.org/stable/api/markers_api.html
以矢量图 SVG 格式显示图片
import matplotlib.pyplot as plt
from matplotlib_inline.backend_inline import set_matplotlib_formats

set_matplotlib_formats("svg")
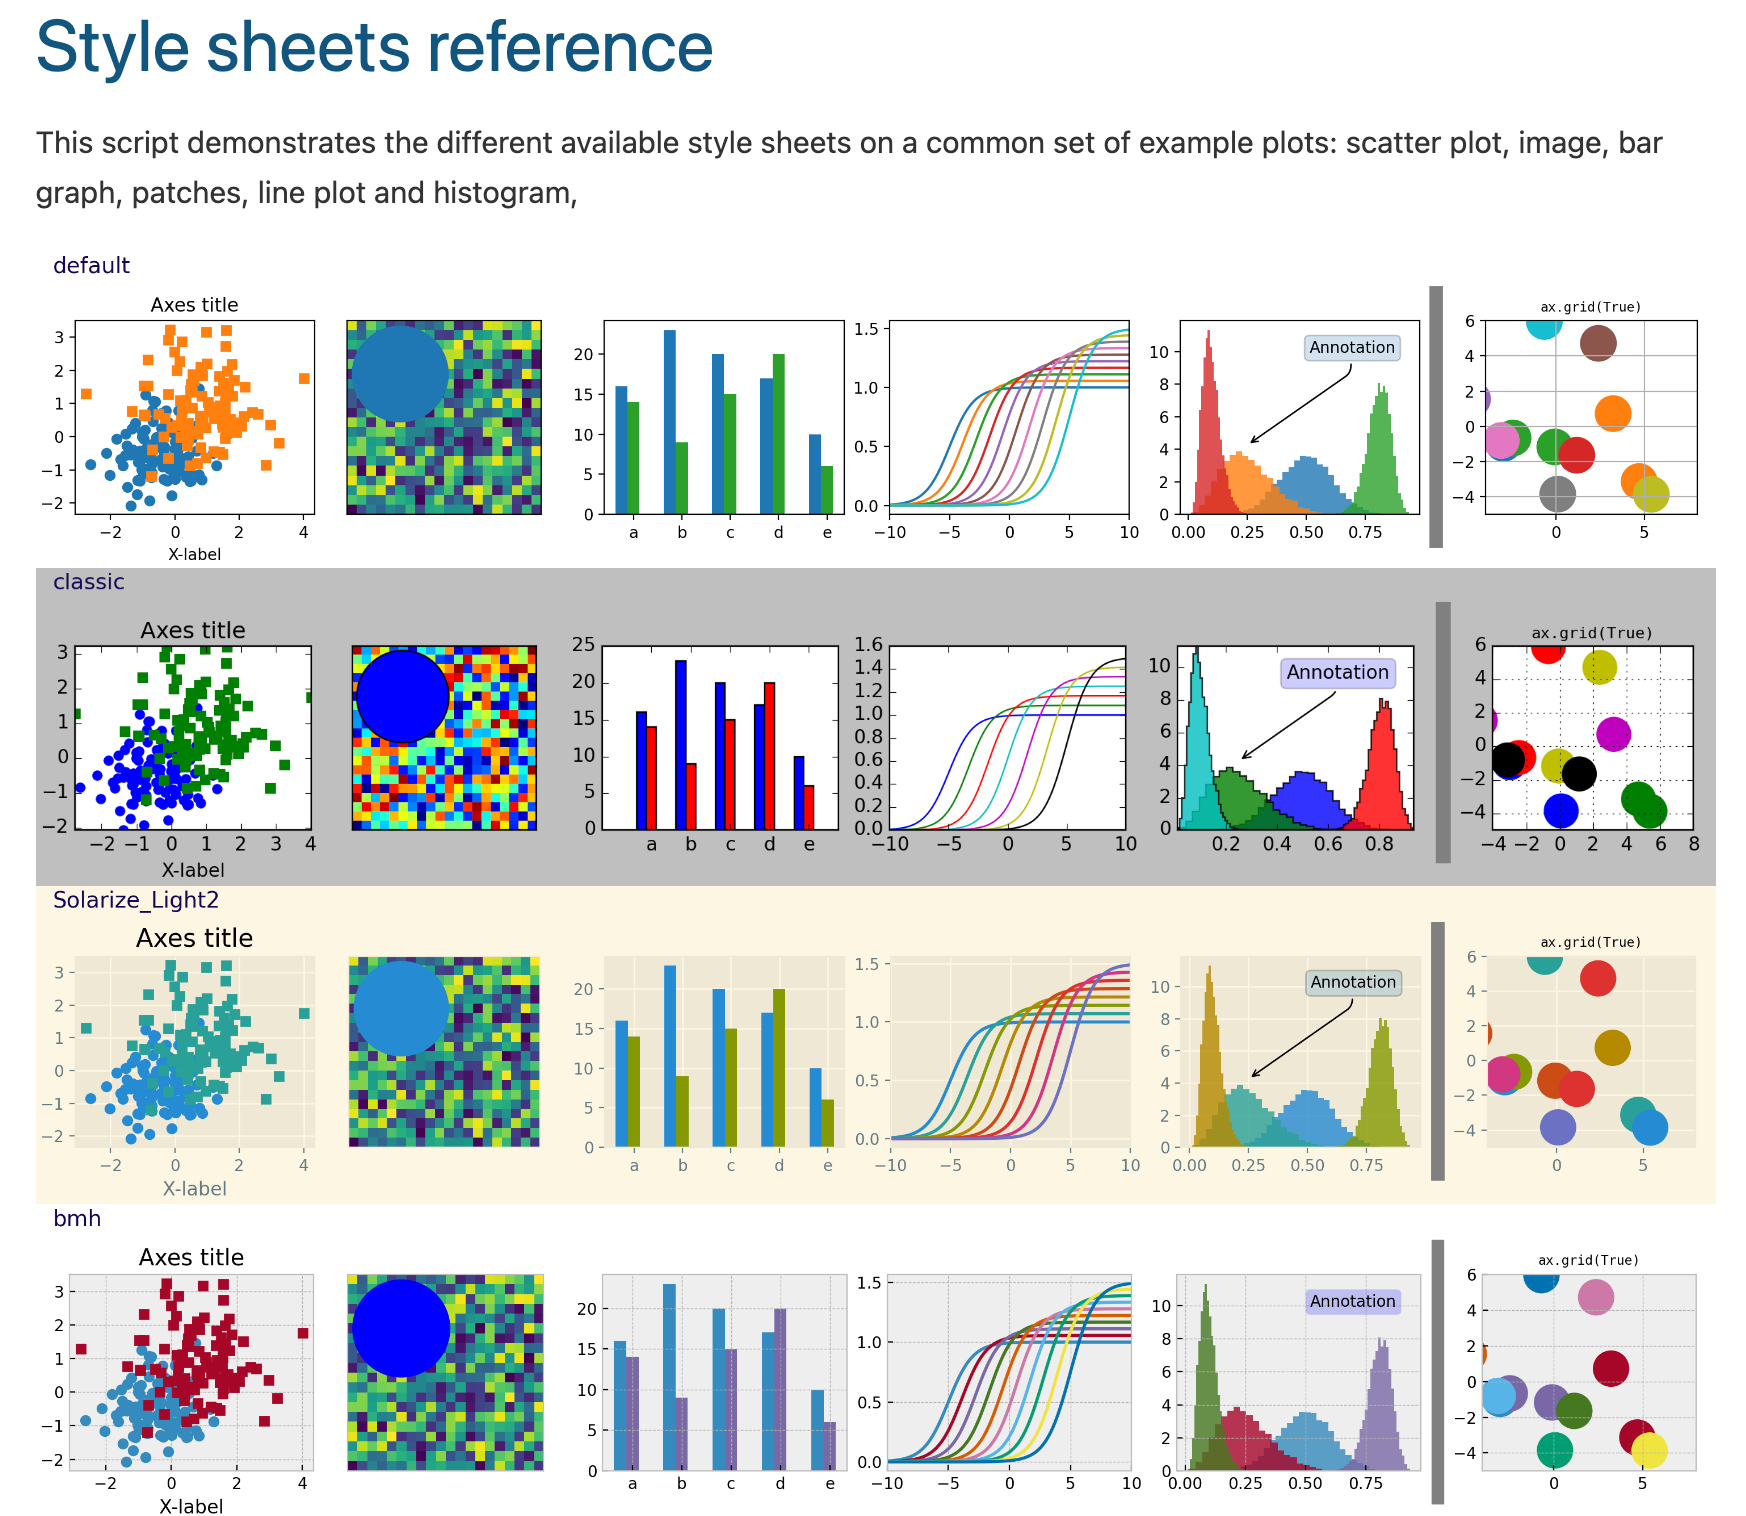
内置主题
内置色系 cmap
Choosing Colormaps in Matplotlib
import matplotlib.pyplot as plt
import numpy as np
# 创建示例数据
x = np.linspace(0, 10, 100)
y = np.sin(x)
plt.figure()
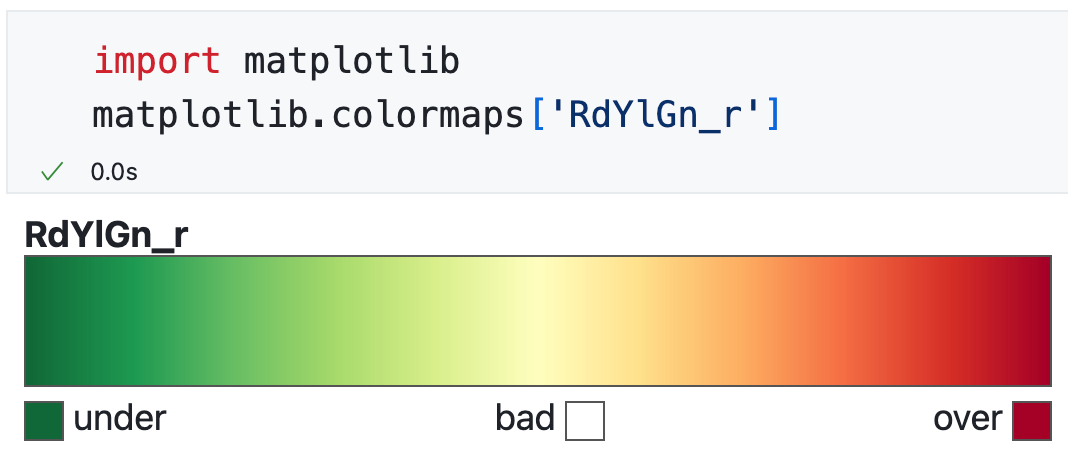
plt.scatter(x, y, c=y, cmap="RdYlGn")
plt.colorbar()
plt.show()

如果需要反转色系,只需在 cmap 名字后面加上 _r 即可:
生成蓝色系

保存图片
直方图
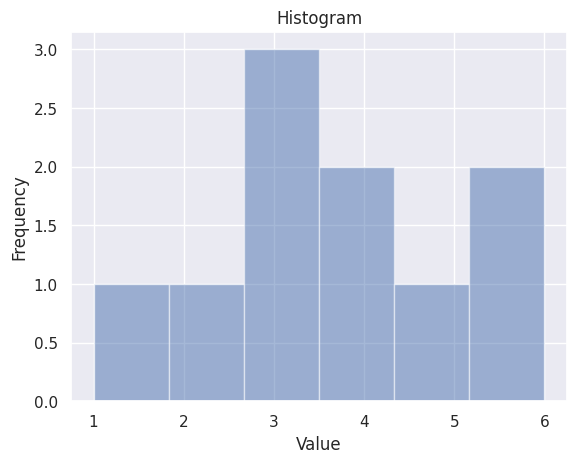
import matplotlib.pyplot as plt

# 输入数据
data = [1, 2, 3, 3, 3, 4, 4, 5, 6, 6]

# 设置直方图的边界和数量
num_bins = 6
bin_width = (max(data) - min(data)) / num_bins
bins = [i * bin_width + min(data) for i in range(num_bins + 1)]

# 绘制直方图
plt.hist(data, bins=bins, alpha=0.5)

# 添加标题和标签
plt.title("Histogram")
plt.xlabel("Value")
plt.ylabel("Frequency")

# 显示图形
plt.show()
num_bins变量将每个 bin(箱子)的数量设置为 6。- 最小值和最大值将根据数据计算,然后按照数量等分成 bin(箱子)。
plt.hist()函数用于绘制直方图,并且alpha参数控制每个 bin 的不透明度。- 标题和标签是可选的,可根据需要进行更改。
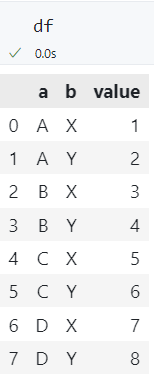
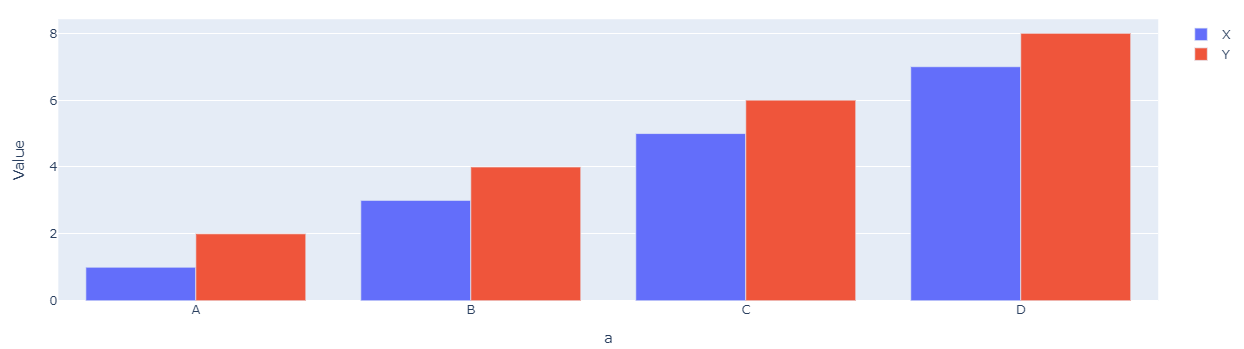
分组柱状图
import plotly.graph_objects as go
import pandas as pd

# 创建示例数据
a_values = ["A", "B", "C", "D"]  # a 的取值
b_values = ["X", "Y", "Z"]  # b 的取值
data = {
    "a": ["A", "A", "B", "B", "C", "C", "D", "D"],
    "b": ["X", "Y", "X", "Y", "X", "Y", "X", "Y"],
    "value": [1, 2, 3, 4, 5, 6, 7, 8],
}
df = pd.DataFrame(data)

# 绘制柱状图
fig = go.Figure()

for b_value in b_values:
    filtered_df = df[df["b"] == b_value]
    fig.add_trace(go.Bar(x=filtered_df["a"], y=filtered_df["value"], name=b_value))

fig.update_layout(
    barmode="group",
    xaxis_title="a",
    yaxis_title="Value",
    title="Multiple Grouped Bar Chart",
)

fig.show()
plotly 绘制相关系数热力图
import numpy as np
import plotly.express as px
import plotly.figure_factory as ff


def plot_correlation_matrix(df):
    # 计算相关系数矩阵
    corr = df.corr()

    # 创建上三角形掩码
    mask = np.triu(np.ones_like(corr, dtype=bool))
    df_mask = corr.mask(mask)

    # 创建带注释的热力图
    fig = ff.create_annotated_heatmap(
        z=df_mask.to_numpy(),
        x=df_mask.columns.tolist(),
        y=df_mask.columns.tolist(),
        colorscale="Blues",
        showscale=True,
        ygap=1,
        xgap=1,
    )

    # 确保 x 轴标签在底部
    fig.update_xaxes(side="bottom")

    # 更新布局
    fig.update_layout(
        title_text="Correlation Matrix",
        title_x=0.5,
        width=1000,
        height=1000,
        xaxis_showgrid=False,
        yaxis_showgrid=False,
        xaxis_zeroline=False,
        yaxis_zeroline=False,
        yaxis_autorange="reversed",
        template="plotly_white",
    )

    # 处理注释:移除 NaN 并保留 2 位小数
    for annotation in fig.layout.annotations:
        if annotation.text == "nan":
            annotation.text = ""
        else:
            try:
                annotation.text = f"{float(annotation.text):.2f}"
            except ValueError:
                continue
            # 设置注释文本颜色
            # 当数值较大时使用白色文本以提高可读性
            value = float(annotation.text)
            annotation.font.color = "white" if value > 0.7 else "black"

    fig.show()
多期回归系数与置信区间
import pandas as pd
import matplotlib.pyplot as plt

# 创建示例数据
years = [2018, 2019, 2020, 2021, 2022]
coefficients = pd.Series([0.5, 0.6, 0.7, 0.8, 0.9])
lower_bounds = [0.4, 0.5, 0.6, 0.7, 0.8]
upper_bounds = [0.6, 0.7, 0.8, 0.9, 1.0]
confidence_intervals = pd.DataFrame(
    {"Lower": lower_bounds, "Upper": upper_bounds}, index=years
)

# 绘制图形
plt.figure(figsize=(10, 6))
plt.plot(years, coefficients, label="Coefficient", marker="o")
plt.fill_between(
    years,
    confidence_intervals["Lower"],
    confidence_intervals["Upper"],
    color="lightblue",
    alpha=0.5,
    label="Confidence Interval",
)
plt.xlabel("Year")
plt.ylabel("Coefficient")
plt.title("Coefficient and Confidence Interval Over Years")
plt.legend()
plt.grid(True)
plt.show()

控制坐标轴标签的距离
纵坐标显示百分比
内置工具
xmax指定原始数据为 100% 时的数值。例如,若原始数据是 0.1、0.2、0.9 等等,则 1.0 代表 100%,因此将xmax设为1.0。如果原始数据是 80、90 等等,则可以将xmax设为 100。decimals代表要保留几位小数。
import matplotlib.pyplot as plt
import matplotlib.ticker as mtick

# 创建一个图形和坐标轴
fig, ax = plt.subplots()

# 假设你有一个 y 值的列表
y = [0.1, 0.2, 0.3, 0.4, 0.5]

# 绘制数据
ax.plot(y)

# 设置 y 轴的刻度格式为百分比
ax.yaxis.set_major_formatter(mtick.PercentFormatter(xmax=1.0, decimals=1))

# 显示图形
plt.show()
自定义函数
from matplotlib.ticker import FuncFormatter


def to_percent(temp, position):
    return "%1.0f" % (100 * temp) + "%"


plt.gca().yaxis.set_major_formatter(FuncFormatter(to_percent))
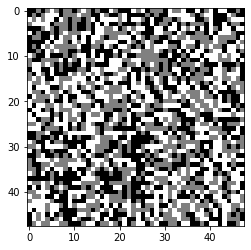
绘制随机的灰度像素图
import matplotlib.pyplot as plt

plt.imshow(np.random.randint(3, size=48 * 48).reshape(48, 48), cmap="gray")
将图例放在图片方框外
隐藏上边框和右边框
import matplotlib.pyplot as plt

# 绘制你的图形
plt.plot([1, 2, 3, 4], [1, 4, 2, 3])

# 获取当前的坐标轴对象
ax = plt.gca()

# 隐藏上边框和右边框
ax.spines["top"].set_visible(False)
ax.spines["right"].set_visible(False)

# 显示结果
plt.show()
绘制自变量与因变量的散点图及一元线性回归直线
# 创建画布,3 行 3 列,每个子图的大小为 30*20
fig, axs = plt.subplots(nrows=3, ncols=3, figsize=(30, 20))
# 遍历每个子图
for i, (ax, col) in enumerate(zip(axs.flat, feature_names)):
    # 获取第 i 列的数据
    x = X[:, i]
    # 使用线性拟合,获取拟合参数
    pf = np.polyfit(x, y, 1)
    # 根据拟合参数,创建拟合函数
    p = np.poly1d(pf)
    # 绘制散点图
    ax.plot(x, y, "o")
    # 绘制拟合曲线
    ax.plot(x, p(x), "r--")
    # 设置子图标题
    ax.set_title(col + " vs Median House Value")
    # 设置 x 轴标签
    ax.set_xlabel(col)
    # 设置 y 轴标签
    ax.set_ylabel("Median House Value")
参考 Interpret regression models using California Housing Prices Dataset。
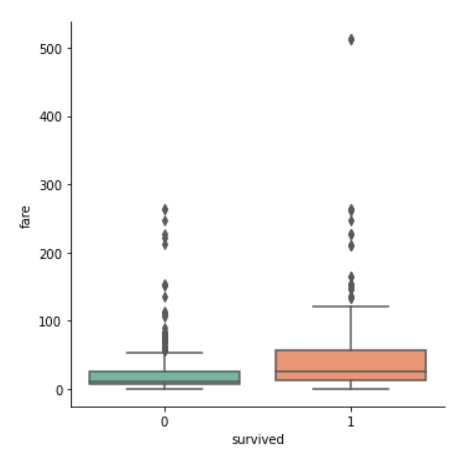
箱线图
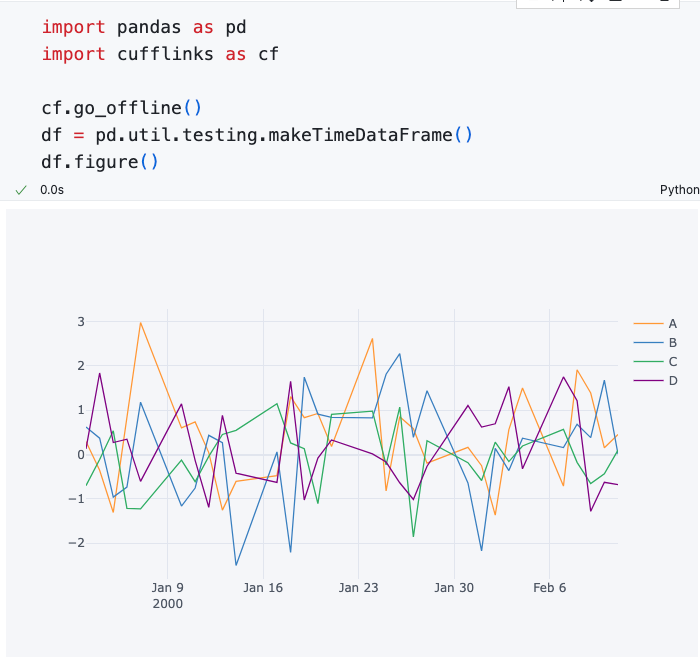
cufflinks
直接对数据框绘图:
import pandas as pd
import cufflinks as cf

cf.go_offline()
df = pd.util.testing.makeTimeDataFrame()
df.figure()
plotly 横坐标为日期时控制日期格式与刻度间隔
在使用 Plotly 创建图表的时候,你可以通过设置 layout 对象中 xaxis 的 tickformat 属性来自定义日期格式。例如,如果你希望 X 轴显示为“年 - 月”的格式,可以设置tickformat为"%Y-%m"。
此外,为了防止刻度标签太过密集,可以利用dtick属性来控制刻度标签的间隔。如果你的数据是日频的,但你想要月频或季频的刻度,可以将dtick设为M3(每三个月)或M6(每六个月)。
import pandas as pd
import plotly.graph_objs as go

# 假设你的 DataFrame 叫做 df,并且它有一个 DatetimeIndex
df = pd._testing.makeTimeDataFrame(nper=1000)

# 创建一个 trace
trace = go.Scatter(x=df.index, y=df["A"])

# 创建 layout,自定义 x 轴
layout = go.Layout(
    xaxis=dict(
        tickformat="%Y-%m",  # 设置日期格式
        dtick="M6",  # 设置刻度间隔为每 6 月
    )
)

# 结合 trace 和 layout 创建 figure
fig = go.Figure(data=[trace], layout=layout)

# 显示图形
fig.show()
PDF 格式图片转换为 PNG 格式
参考 https://stackoverflow.com/a/69644244/、https://stackoverflow.com/a/73645583/
import fitz

file_path = "my_file.pdf"
doc = fitz.open(file_path)  # open document
for i, page in enumerate(doc):
    pix = page.get_pixmap(dpi=300)  # (1)
    pix.save(f"my_file_page_{i}.png")
- 可以修改
dpi来调整清晰度。
可能遇到安装的问题
raise RuntimeError(f"Directory '{directory}' does not exist") RuntimeError: Directory 'static/' does not exist from import fitz,参考 https://stackoverflow.com/a/71225681/
保存 shap.plots.text(shap_values) 为 HTML
file = open("temp.html", "w")
file.write(shap.plots.text(shap_values, display=False))
file.close()
参考:https://github.com/shap/shap/issues/2379#issuecomment-1163554306