基于 qstock 实现条件选股回测
基于 qstock 获取多只股票的历史价格数据,对选股结果进行定期调仓回测。
导入包和定义获取、处理数据、绩效评价和绘图等函数
qstock由“Python 金融量化”公众号开发,可用于获取各个市场的实时和历史数据。本文基于 qstock 获取历史数据,对选股结果进行回测。
# 导入包
import pandas as pd
import qstock as qs
from tqdm import tqdm
import warnings
from highcharts import Highstock


# 定义函数
# 获取调仓日以及持仓的股票
def get_change_position_date_and_stocks(selected_stocks):
    # 根据报告期对应的截至日期,提取出每季度选出的股票代码
    report_date_and_stocks = (
        selected_stocks.groupby("报告日期的截止日")["股票代码"]
        .apply(lambda g: g.values.tolist())
        .to_dict()
    )
    # 将报告报告期对应的截至日期转换为调仓日期
    change_position_date_list = []
    for report_date in report_date_and_stocks.keys():
        # 若报告期的截止日是第一季度的最后一天,则对应的调仓日是4月30日
        if report_date.month == 3:
            change_position_date = "{}{}{}".format(report_date.year, "04", "30")
        # 若报告期的截止日是第二季度的最后一天,则对应的调仓日是8月31日
        elif report_date.month == 6:
            change_position_date = "{}{}{}".format(report_date.year, "08", "31")
        # 若报告期的截止日是第三季度的最后一天,则对应的调仓日是10月31日
        elif report_date.month == 9:
            change_position_date = "{}{}{}".format(report_date.year, "10", "31")
        else:
            raise ValueError
        change_position_date_list.append(change_position_date)
    change_position_date_and_stocks = dict(
        zip(change_position_date_list, report_date_and_stocks.values())
    )
    return change_position_date_and_stocks


# 获取多只股票的每日收盘价格
def get_price_of_many_stocks(code_list, start, end):
    price = pd.DataFrame()
    for code in tqdm(code_list, leave=False):
        price_stock = qs.get_data(
            code_list=code, start=start, end=end, freq="d", fqt=2
        )["close"]
        price_stock.name = code
        price = pd.concat([price, price_stock], axis=1)
    return price


# 将收益率数据转换为价格数据
def prices_from_returns(returns):
    ret = 1 + returns
    ret.iloc[0] = 1
    return ret.cumprod()


# 计算策略评价指标
def strategy_evaluate(equity):
    """
    :param equity:  每天的资金曲线
    :return:
    """

    # ===新建一个dataframe保存回测指标
    results = pd.DataFrame()

    # 将数字转为百分数
    def num_to_pct(value):
        return "%.2f%%" % (value * 100)

    # ===计算累积净值
    results.loc[0, "累积净值"] = round(equity["组合净值"].iloc[-1], 2)

    # ===计算年化收益
    annual_return = (equity["组合净值"].iloc[-1]) ** (
        1 / (equity["交易日期"].iloc[-1] - equity["交易日期"].iloc[0]).days * 365
    ) - 1
    results.loc[0, "年化收益"] = str(round(annual_return * 100, 2)) + "%"

    # ===计算最大回撤,最大回撤的含义:《如何通过3行代码计算最大回撤》https://mp.weixin.qq.com/s/Dwt4lkKR_PEnWRprLlvPVw
    # 计算当日之前的资金曲线的最高点
    equity["max2here"] = equity["组合净值"].expanding().max()
    # 计算到历史最高值到当日的跌幅,drowdwon
    equity["dd2here"] = equity["组合净值"] / equity["max2here"] - 1
    # 计算最大回撤,以及最大回撤结束时间
    end_date, max_draw_down = tuple(
        equity.sort_values(by=["dd2here"]).iloc[0][["交易日期", "dd2here"]]
    )
    # 计算最大回撤开始时间
    start_date = (
        equity[equity["交易日期"] <= end_date]
        .sort_values(by="组合净值", ascending=False)
        .iloc[0]["交易日期"]
    )
    # 将无关的变量删除
    equity.drop(["max2here", "dd2here"], axis=1, inplace=True)
    results.loc[0, "最大回撤"] = format(max_draw_down, ".2%")
    results.loc[0, "最大回撤开始时间"] = str(start_date)
    results.loc[0, "最大回撤结束时间"] = str(end_date)

    # ===年化收益/回撤比:
    results.loc[0, "年化收益/回撤比"] = round(annual_return / abs(max_draw_down), 2)

    # ===每年、每月收益率
    equity.set_index("交易日期", inplace=True)
    year_return = (
        equity[["组合收益率", "指数收益率"]]
        .resample(rule="A")
        .apply(lambda x: (1 + x).prod() - 1)
    )
    monthly_return = (
        equity[["组合收益率", "指数收益率"]]
        .resample(rule="M")
        .apply(lambda x: (1 + x).prod() - 1)
    )

    year_return["超额收益"] = year_return["组合收益率"] - year_return["指数收益率"]
    monthly_return["超额收益"] = monthly_return["组合收益率"] - monthly_return["指数收益率"]

    year_return["组合收益率"] = year_return["组合收益率"].apply(num_to_pct)
    year_return["指数收益率"] = year_return["指数收益率"].apply(num_to_pct)
    year_return["超额收益"] = year_return["超额收益"].apply(num_to_pct)

    monthly_return["组合收益率"] = monthly_return["组合收益率"].apply(num_to_pct)
    monthly_return["指数收益率"] = monthly_return["指数收益率"].apply(num_to_pct)
    monthly_return["超额收益"] = monthly_return["超额收益"].apply(num_to_pct)

    return results.T, year_return, monthly_return


# 绘制净值曲线
def draw_equity_curve(
    prices, returns_data=False, title="Equity Curve", output_path=None
):
    # 将传入的数据修改为数据框
    if not isinstance(prices, pd.DataFrame):
        warnings.warn("prices are not in a dataframe", RuntimeWarning)
        prices = pd.DataFrame(prices)
    # 将索引修改为日期时间格式
    if not isinstance(prices.index, pd.DatetimeIndex):
        prices.index = pd.to_datetime(prices.index)
    # 如果传入的是收益率数据,则需要转换成价格数据
    if returns_data:
        prices = prices_from_returns(prices)
    # 初始化绘图对象
    H = Highstock()
    # 导入每一个资产的价格数据
    for column in prices.columns:
        H.add_data_set(
            data=prices[column].reset_index().values.tolist(),
            series_type="line",
            name=column,
        )
    # 设置绘图参数
    options = {
        "title": {"text": title},
        "rangeSelector": {"selected": 5},  # 1-5的数字代表默认观察窗口为1m、3m、6m、YTM、1y和All
        "yAxis": {
            "labels": {
                "formatter": "function () {\
                                return (this.value > 0 ? ' + ' : '') + this.value + '%';\
                            }"
            },  # this.value > 0 ? ' + '可以在正收益的数值前加上“+”
            # 绘制纵轴为0的横线
            "plotLines": [{"value": 0, "width": 2, "color": "silver"}],
        },
        "plotOptions": {"series": {"compare": "percent"}},
        "tooltip": {
            "pointFormat": '<span style="color:{series.color}">{series.name}:</span> <b>{point.y}</b> ({point.change}%)<br/>',
            "valueDecimals": 2,  # 默认显示的小数位
        },
    }
    # 应用绘图参数
    H.set_dict_options(options)
    # 如果指定了输出路径,则输出html文件到这个路径
    if output_path:
        f = open("{}.html".format(output_path), "w")
        f.write(H.htmlcontent)
        f.close()
    return H
# 读取历史选股数据(每季度 15 只)
selected_stocks = pd.read_csv(
    "./selected_stocks.csv", parse_dates=["报告日期的截止日"], encoding="gbk"
)  # parse_dates 将'报告日期的截止日'这一列识别为日期格式,gbk 编码支持中文
# 截取“股票代码”和“报告日期的截止日”这两列
selected_stocks = selected_stocks[["股票代码", "报告日期的截止日"]]
# 将“股票代码”的后缀“.SH”去掉
selected_stocks["股票代码"] = selected_stocks["股票代码"].apply(lambda x: x[:-3])
# 获取调仓日以及持仓的股票
change_position_date_and_stocks = get_change_position_date_and_stocks(selected_stocks)
# 获取调仓日的列表
change_position_date_list = list(change_position_date_and_stocks.keys())
计算组合收益率(使用简单加权的粗略算法)
使用简单加权的粗略算法计算组合收益率,这一方法存在一定的缺陷。
例如,若资产组合包含两个资产,第一个资产每天的收益率都是\(-10\%\),第二个资产每天的收益率都是\(+10\%\)。
按照简单加权的粗略算法,第一天,第一个资产的价格变成了\(1\times(1-10\%)=0.9\),第二个资产的价格变成了\(1\times(1+10\%)=1.1\),因此资产组合的净值是\(\frac{0.9+1.1}{2}=1\)。根据简单加权的粗略算法,资产组合在第一天的收益率是\(\frac{-10\%+10\%}{2}=0\)。这个结果在第一天确实是对的。
但是,第二天的时候,第一个资产的价格变成了\(0.9\times(1-10\%)=0.81\),第二个资产的价格变成了\(1.1\times(1+10\%)=1.21\),因此资产组合的净值是\(\frac{0.81+1.21}{2}=1.005\),因此资产组合在第二天的收益率是 0.5%。但是,根据简单加权的粗略算法,资产组合在第一天的收益率仍然是\(\frac{-10\%+10\%}{2}=0\)。
造成这一差异的根本原因在于,资产组合内部的权重是会随着各资产的涨跌而改变的。一个资产上涨得越多,它的涨跌幅对整个资产组合涨跌幅的影响也越大。
这里为了简便,只使用简单加权的粗略算法计算组合收益率。更为精确的算法可以是:将各股票看作是投资组合的一部分,每天跟踪这一部分净值的变化,到下一调仓日再将各部分的净值相加,即得到整个投资组合的净值。
# 创建空数据框,用于存放组合收益率
portfolio_return = pd.DataFrame()
# 对每一个调仓日,获取当日的股票价格,将价格转换为收益率,并计算组合在这段持有期的收益率
pbar = tqdm(change_position_date_list)
for change_position_date in pbar:
    pbar.set_description("正在计算从%s开始的组合每日收益率" % change_position_date)
    # 获取这一个调仓日至下一个调仓日之间的持仓股票价格
    code_list = change_position_date_and_stocks[change_position_date]
    # 获取下一个调仓日
    if (
        change_position_date == change_position_date_list[-1]
    ):  # 如果是最后一个调仓日,则下一个调仓日在change_position_date_list中找不到,需要手动设置为2022年8月31日
        next_change_position_date = "20220831"
    else:  # 否则下一个调仓日可以直接在change_position_date_list中找到
        next_change_position_date = change_position_date_list[
            change_position_date_list.index(change_position_date) + 1
        ]
    # 获取这一个调仓日至下一个调仓日之间的持仓股票价格
    stock_price = get_price_of_many_stocks(
        code_list=code_list, start=change_position_date, end=next_change_position_date
    )  # fqt=2表示后复权
    # 将价格转换为收益率,且删除全是空值的行(即第一行)
    stock_return = stock_price.pct_change().dropna(how="all")
    # 对收益率进行加权求和,得到组合收益率,并将结果添加到portfolio_return中
    portfolio_return_in_this_quarter = stock_return.mul(
        1 / len(stock_return.columns), axis=1
    ).sum(axis=1)
    portfolio_return = pd.concat(
        [portfolio_return, portfolio_return_in_this_quarter], axis=0
    )
获取组合净值和基准指数净值
# 获取中证500指数的价格
index_price = qs.get_price(
    code_list=["中证500"], start="20100504", end="20220831", freq="d", fqt=2
)
# 将中证500指数的价格归一化
index_price = index_price.div(index_price.iloc[0])
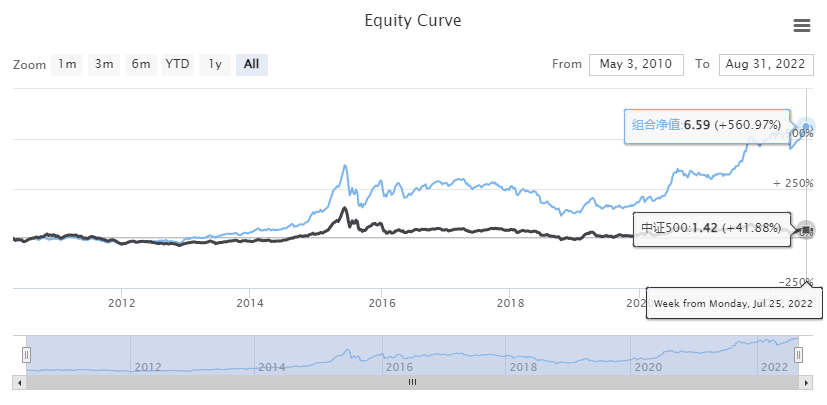
绘制净值曲线
绩效评价
| 0 | |
|---|---|
| 累积净值 | 6.31 |
| 年化收益 | 16.11% |
| 最大回撤 | -56.75% |
| 最大回撤开始时间 | 2015-06-12 00:00:00 |
| 最大回撤结束时间 | 2018-10-18 00:00:00 |
| 年化收益/回撤比 | 0.28 |
| 组合收益率 | 指数收益率 | 超额收益 | |
|---|---|---|---|
| 交易日期 | |||
| 2010-12-31 | -3.12% | 11.33% | -14.45% |
| 2011-12-31 | -26.29% | -33.83% | 7.53% |
| 2012-12-31 | 32.59% | 0.28% | 32.31% |
| 2013-12-31 | 36.37% | 16.89% | 19.48% |
| 2014-12-31 | 78.17% | 39.01% | 39.17% |
| 2015-12-31 | 68.05% | 43.12% | 24.93% |
| 2016-12-31 | -3.76% | -17.78% | 14.02% |
| 2017-12-31 | -6.39% | -0.20% | -6.19% |
| 2018-12-31 | -36.16% | -33.32% | -2.84% |
| 2019-12-31 | 27.43% | 26.38% | 1.05% |
| 2020-12-31 | 49.32% | 20.87% | 28.45% |
| 2021-12-31 | 44.83% | 15.58% | 29.24% |
| 2022-12-31 | 3.05% | -16.36% | 19.40% |
| 组合收益率 | 指数收益率 | 超额收益 | |
|---|---|---|---|
| 交易日期 | |||
| 2010-05-31 | -10.60% | -7.44% | -3.17% |
| 2010-06-30 | -8.02% | -10.72% | 2.70% |
| 2010-07-31 | 15.30% | 14.37% | 0.93% |
| 2010-08-31 | 10.09% | 9.50% | 0.59% |
| 2010-09-30 | -9.61% | 1.55% | -11.16% |
| ... | ... | ... | ... |
| 2022-04-30 | -10.71% | -11.02% | 0.31% |
| 2022-05-31 | 4.69% | 7.08% | -2.38% |
| 2022-06-30 | 5.59% | 7.10% | -1.51% |
| 2022-07-31 | 6.65% | -2.48% | 9.13% |
| 2022-08-31 | -4.40% | -2.20% | -2.20% |
148 rows × 3 columns