舍选法生成随机变量
针对离散变量,使用判别方法生成随机变量。针对连续变量,使用舍选法生成随机变量。
分布形状:\(\Gamma(2,1)\) 随机数
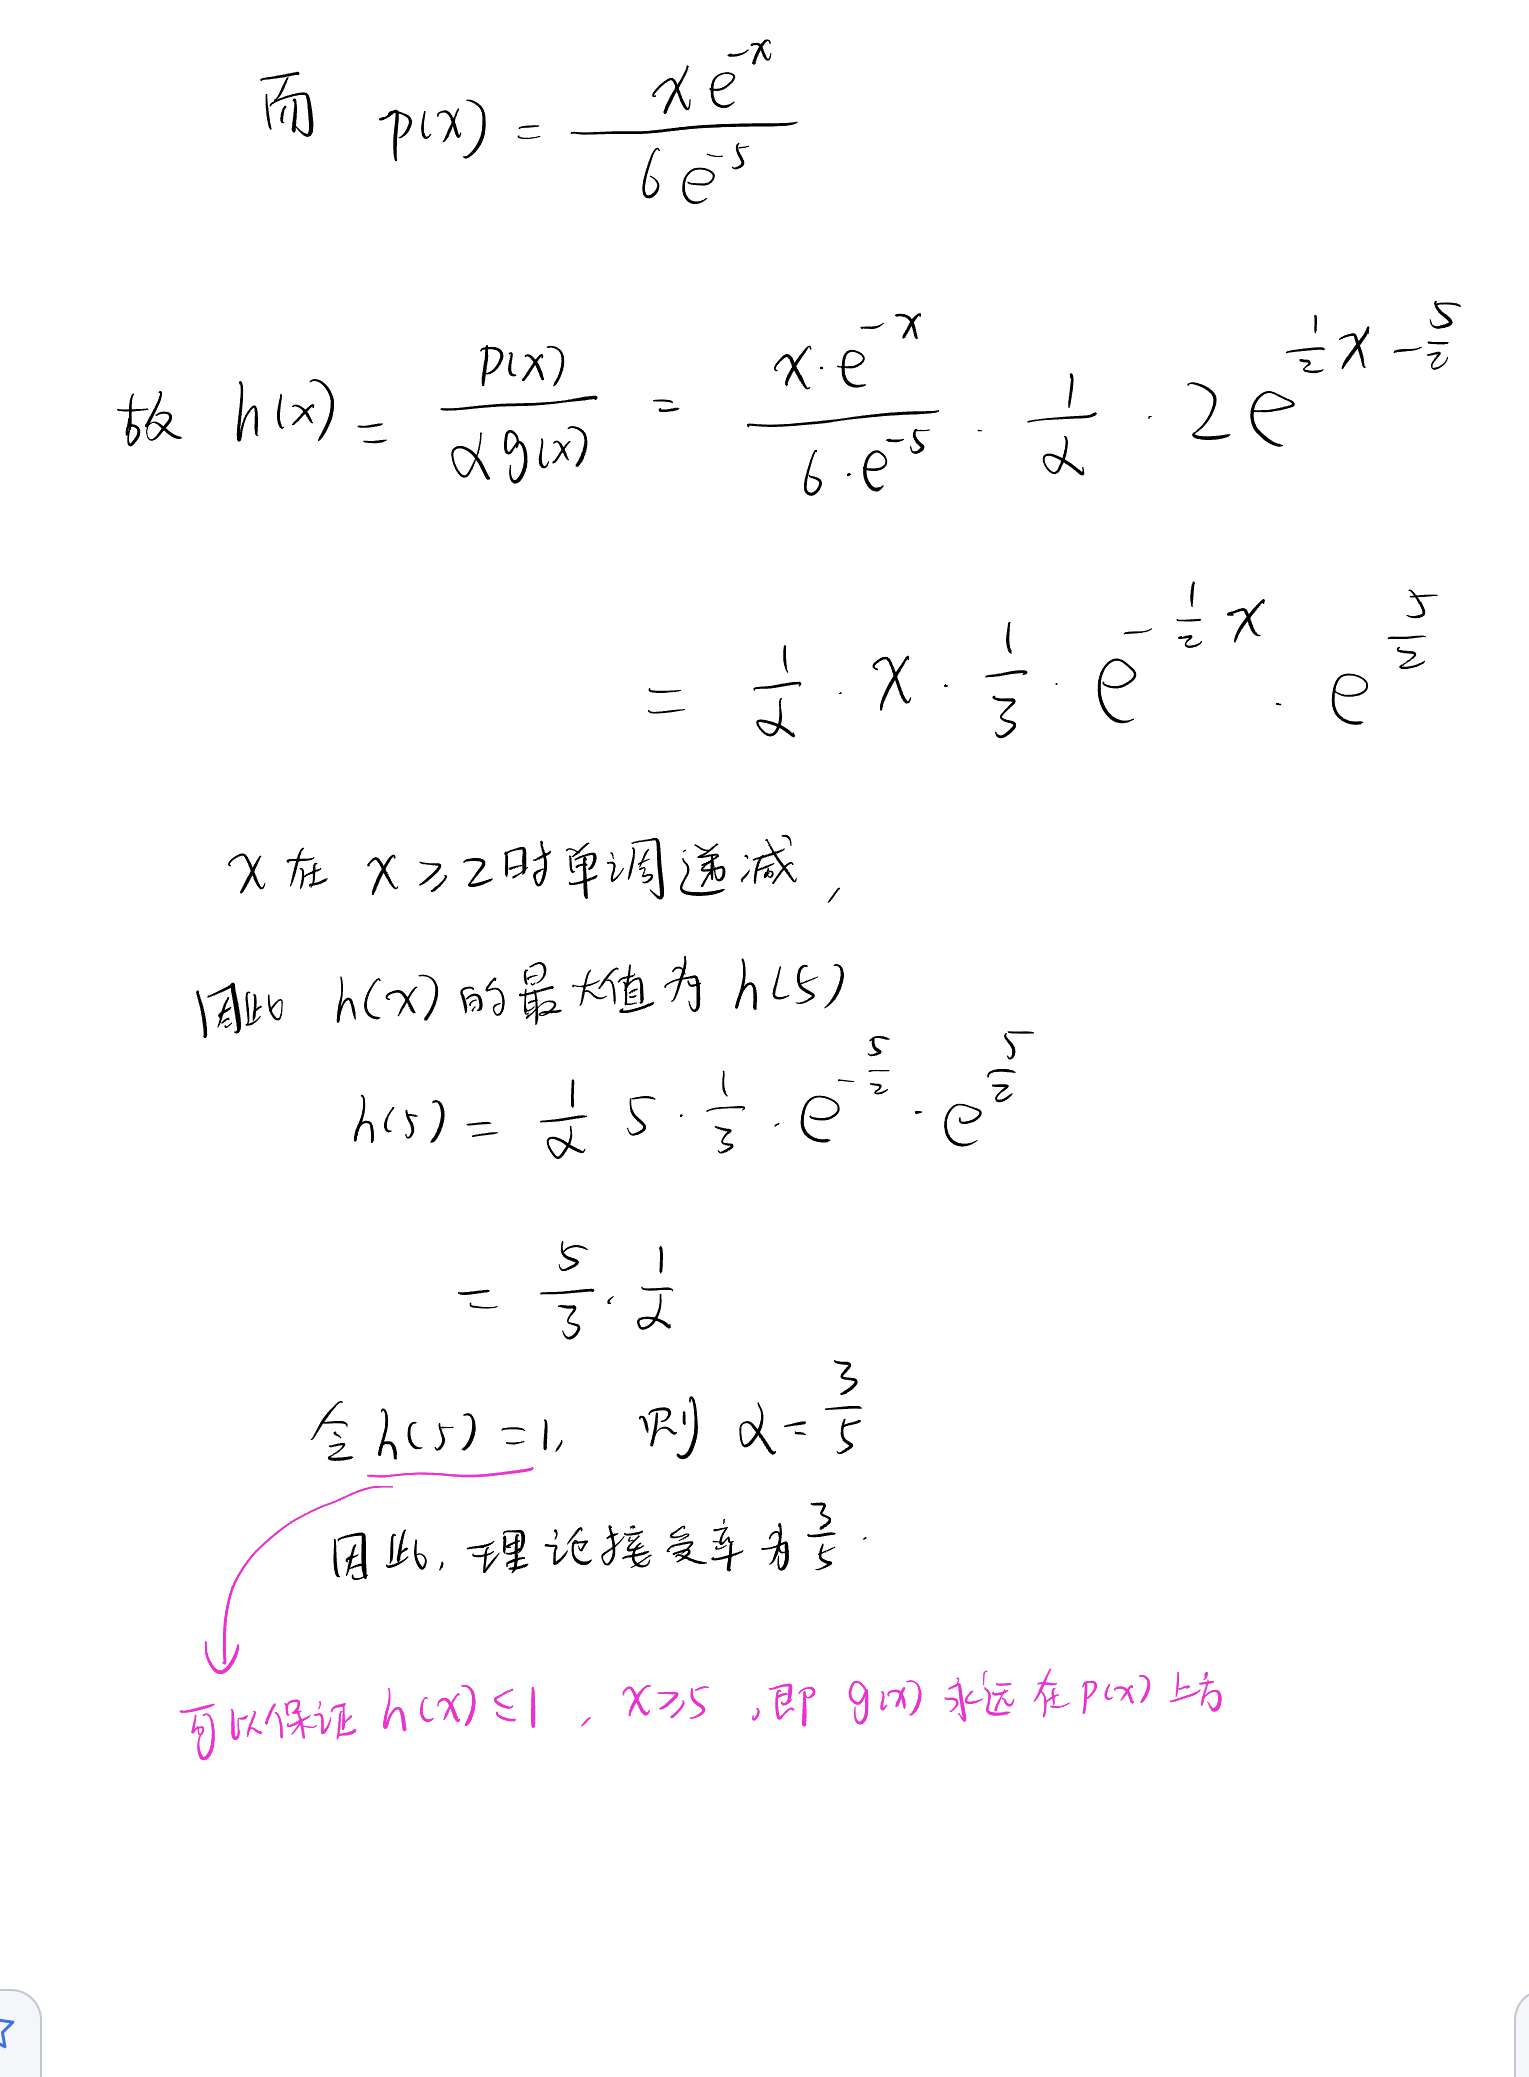
舍选法的理论推导
Python
import random
import numpy as np
import math
import matplotlib.pyplot as plt

plt.rcParams["axes.unicode_minus"] = False
plt.rcParams["font.sans-serif"] = ["SimHei"]
# 字号大小
plt.rcParams["font.size"] = 16
# 渲染公式
plt.rcParams["text.usetex"] = True
离散变量:生成 1 个二项分布随机数的算法
-
生成在 0 到 1 上均匀分布的随机数\(U \sim U(0,1)\),且令\(t=1\);
-
判断\(U\)是否小于\(0.7\),若是,则\(X_t=1\),否则\(X_t=0\),并令\(t=t+1\);
-
若\(t>n\),则退出循环,返回\(\sum_{t=1}^{n} X_t\),否则重复步骤 1 和 2;
Python
def random_binomial(n, p):
    success = 0
    for i in range(n):
        if random.uniform(0, 1) <= p:
            success += 1
    return success
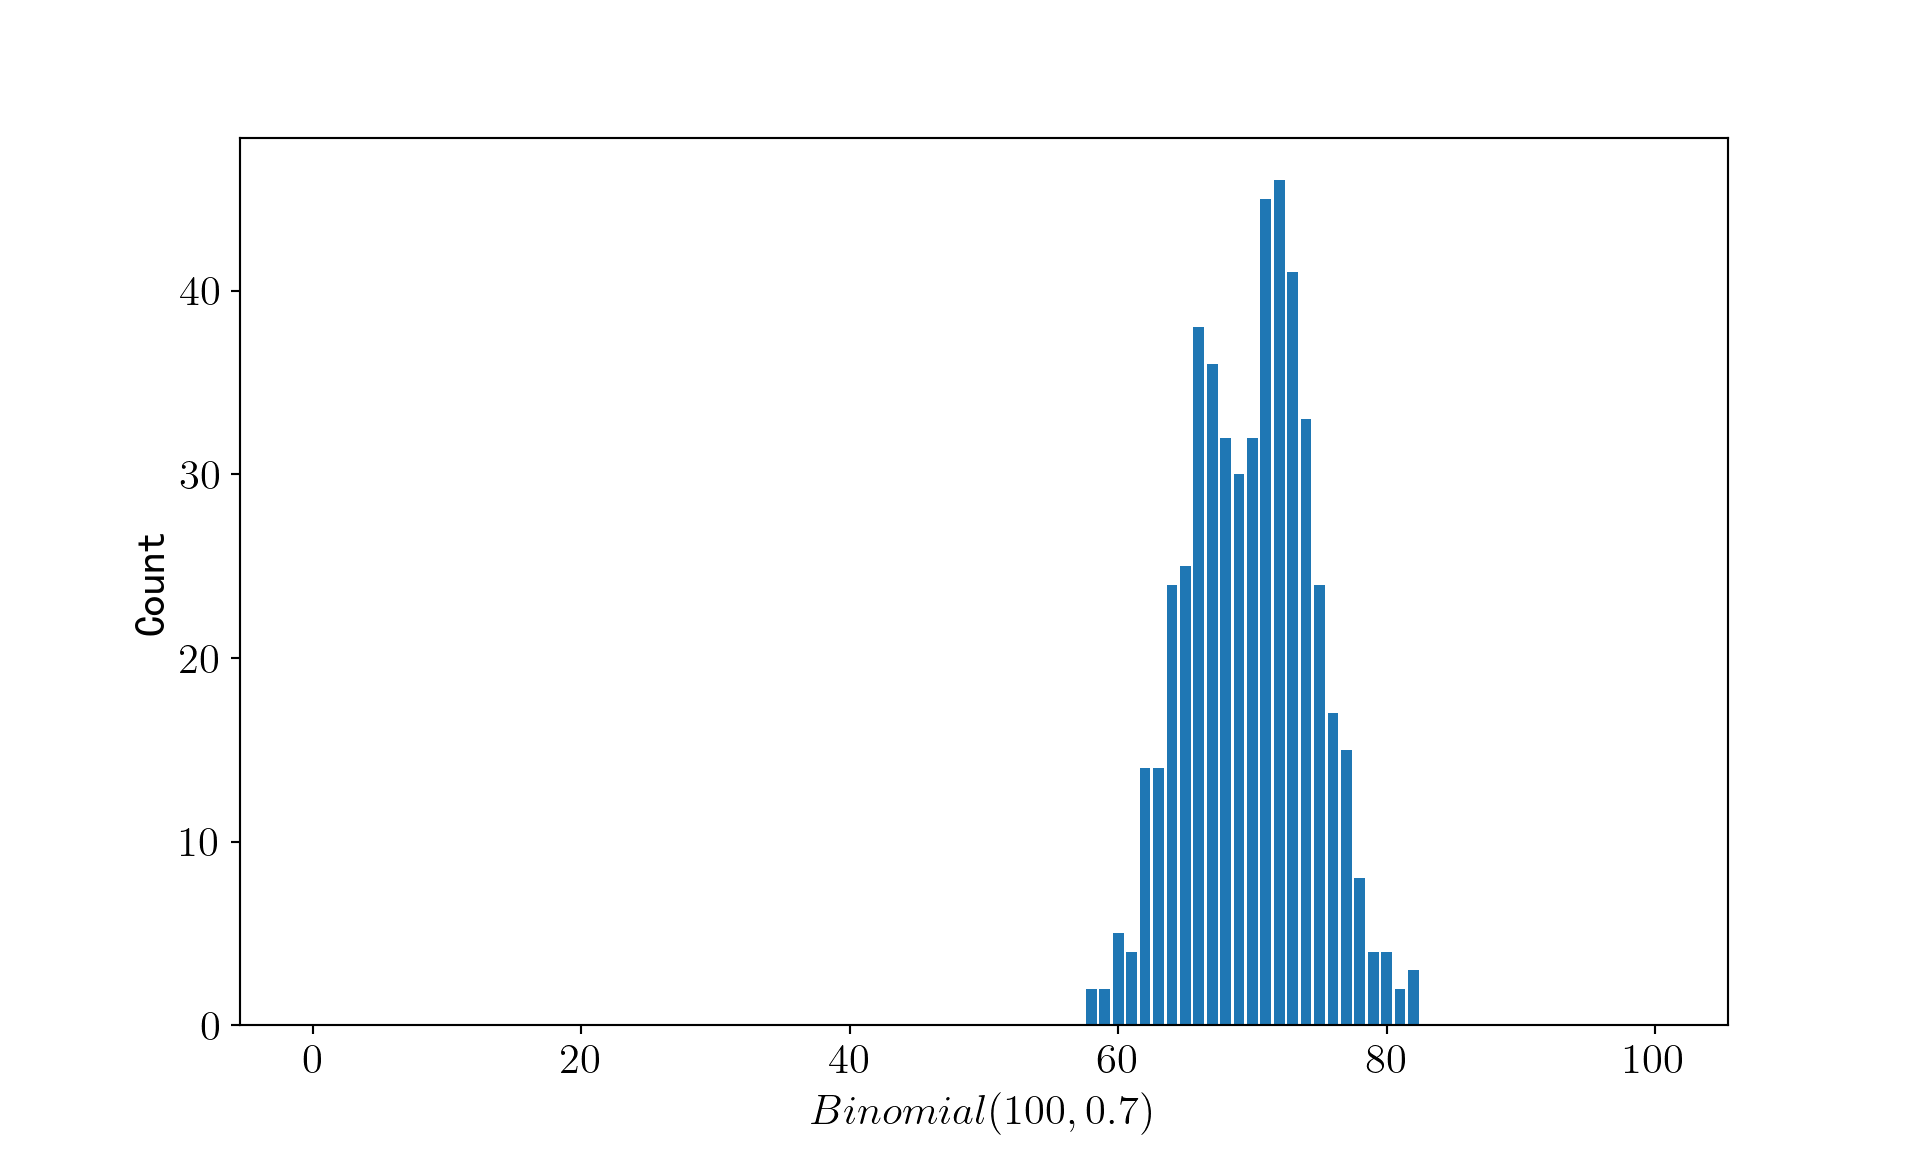
生成 500 个服从 b(100, 0.7) 的二项分布随机数
Python
number_of_random_variavles = 500

n = 100
p = 0.7

random_binomial_list = []
for i in range(number_of_random_variavles):
    random_binomial_list.append(random_binomial(n, p))
绘制随机数的柱状图
Python
fig = plt.figure(figsize=(10, 6))
ax = fig.add_subplot(111)
ax.bar(range(0, n + 1), [random_binomial_list.count(i) for i in range(0, n + 1)])
连续变量:舍选法
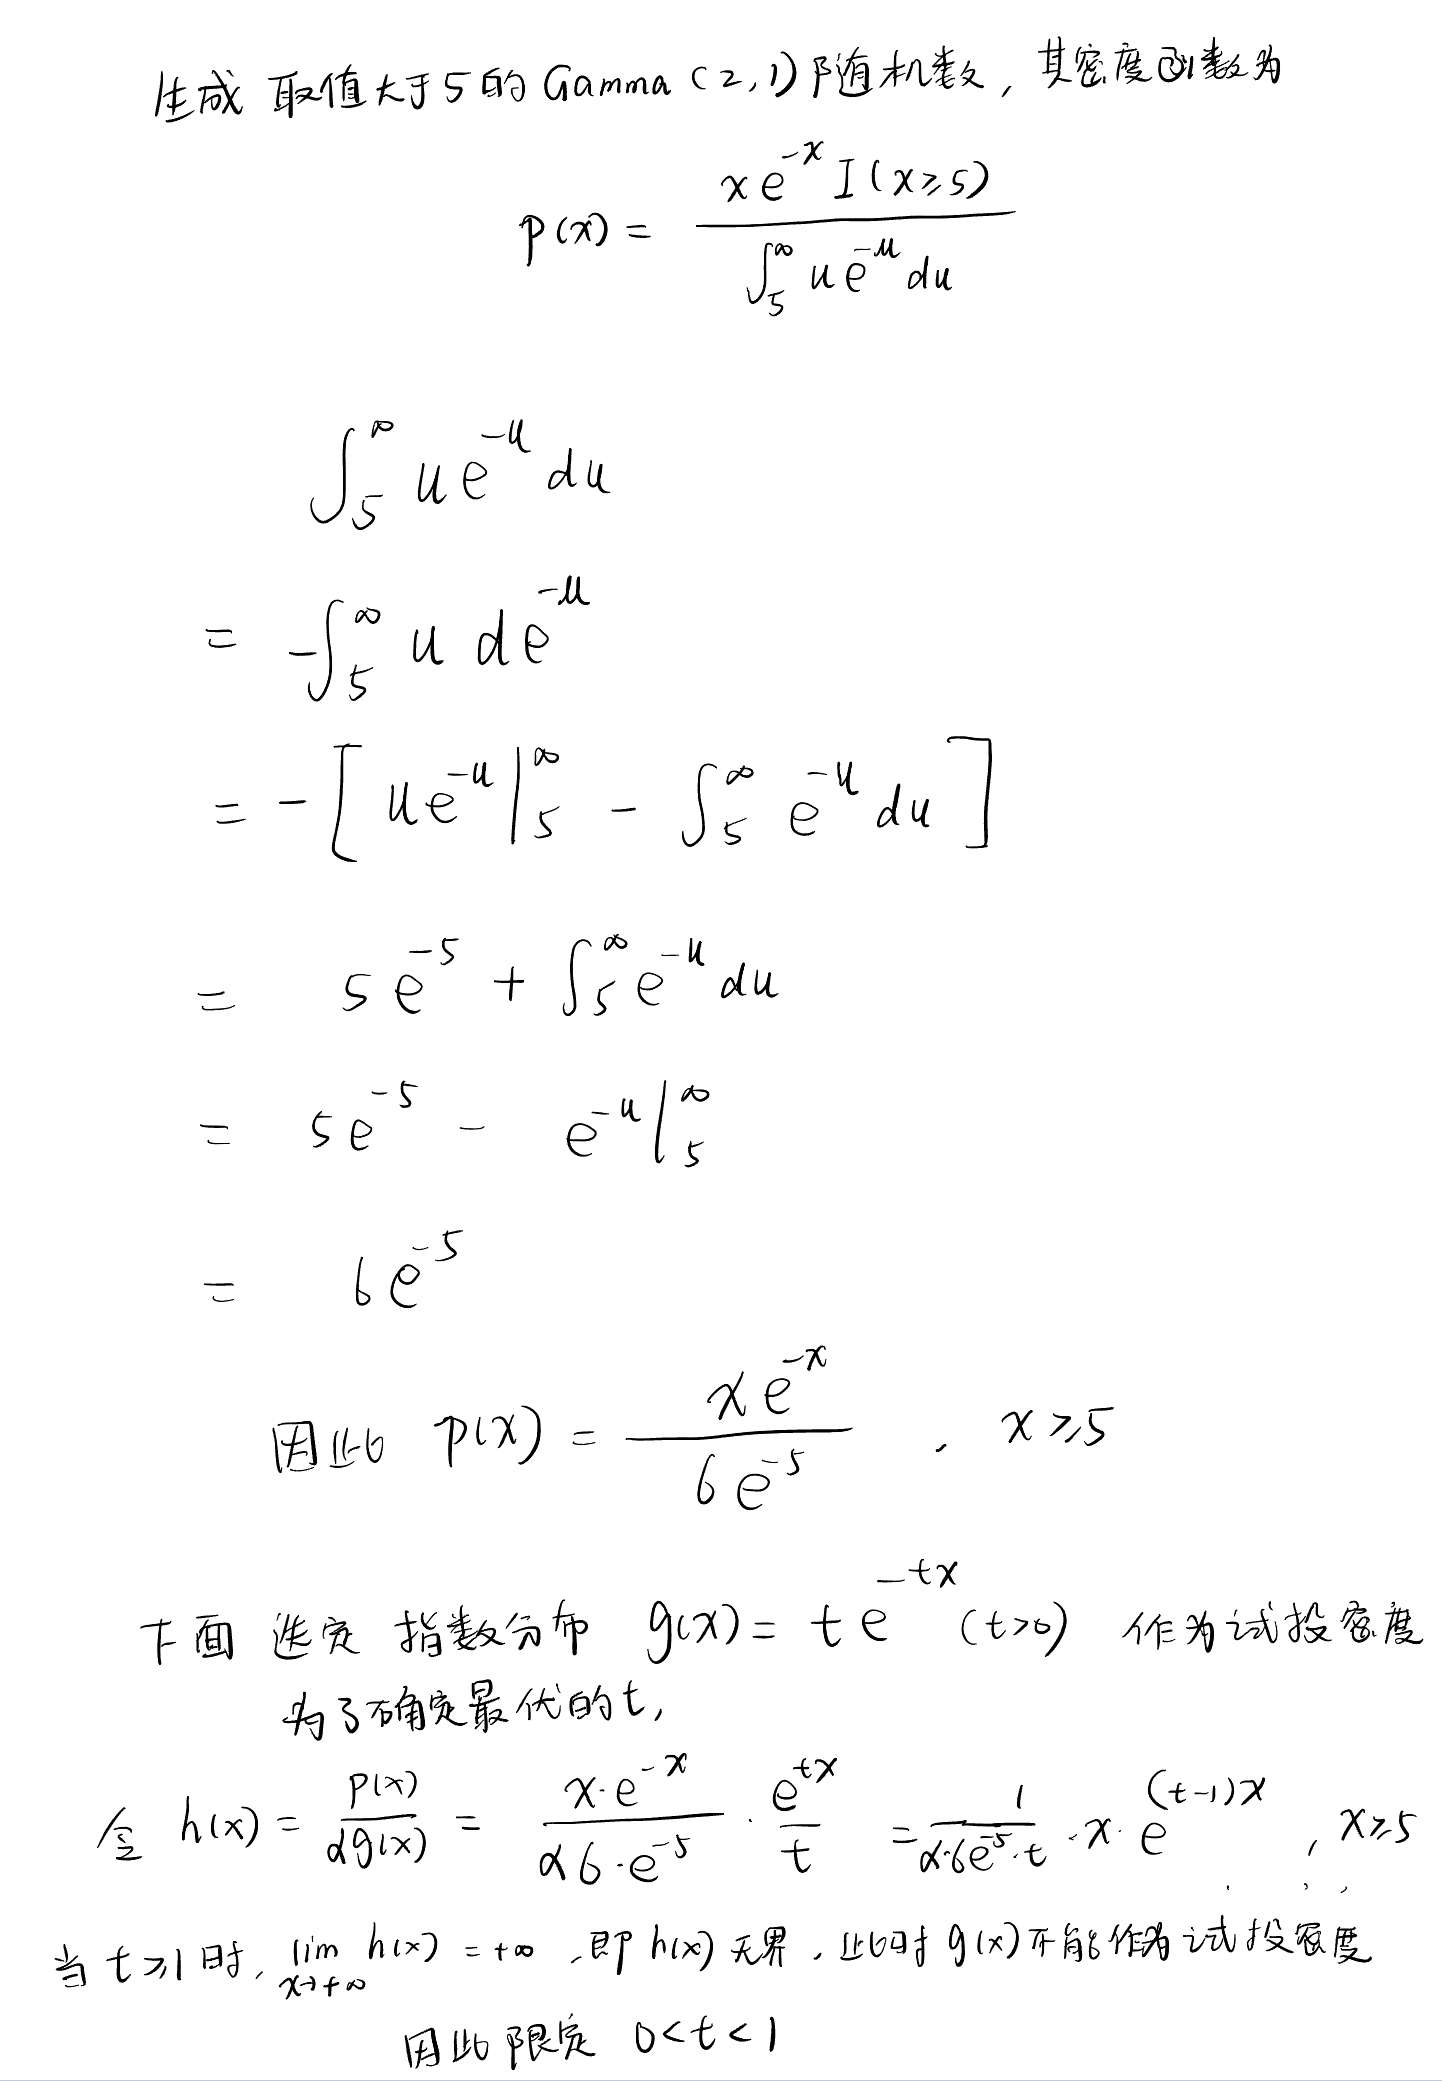
用舍选法生成 500 个取值大于 5 的\(\Gamma(2, 1)\)随机数,其密度函数为:
\[
p(x)=\frac{x e^{-x} 1\{x \geq 5\}}{\int_5^{\infty} u e^{-u} d u}
\]
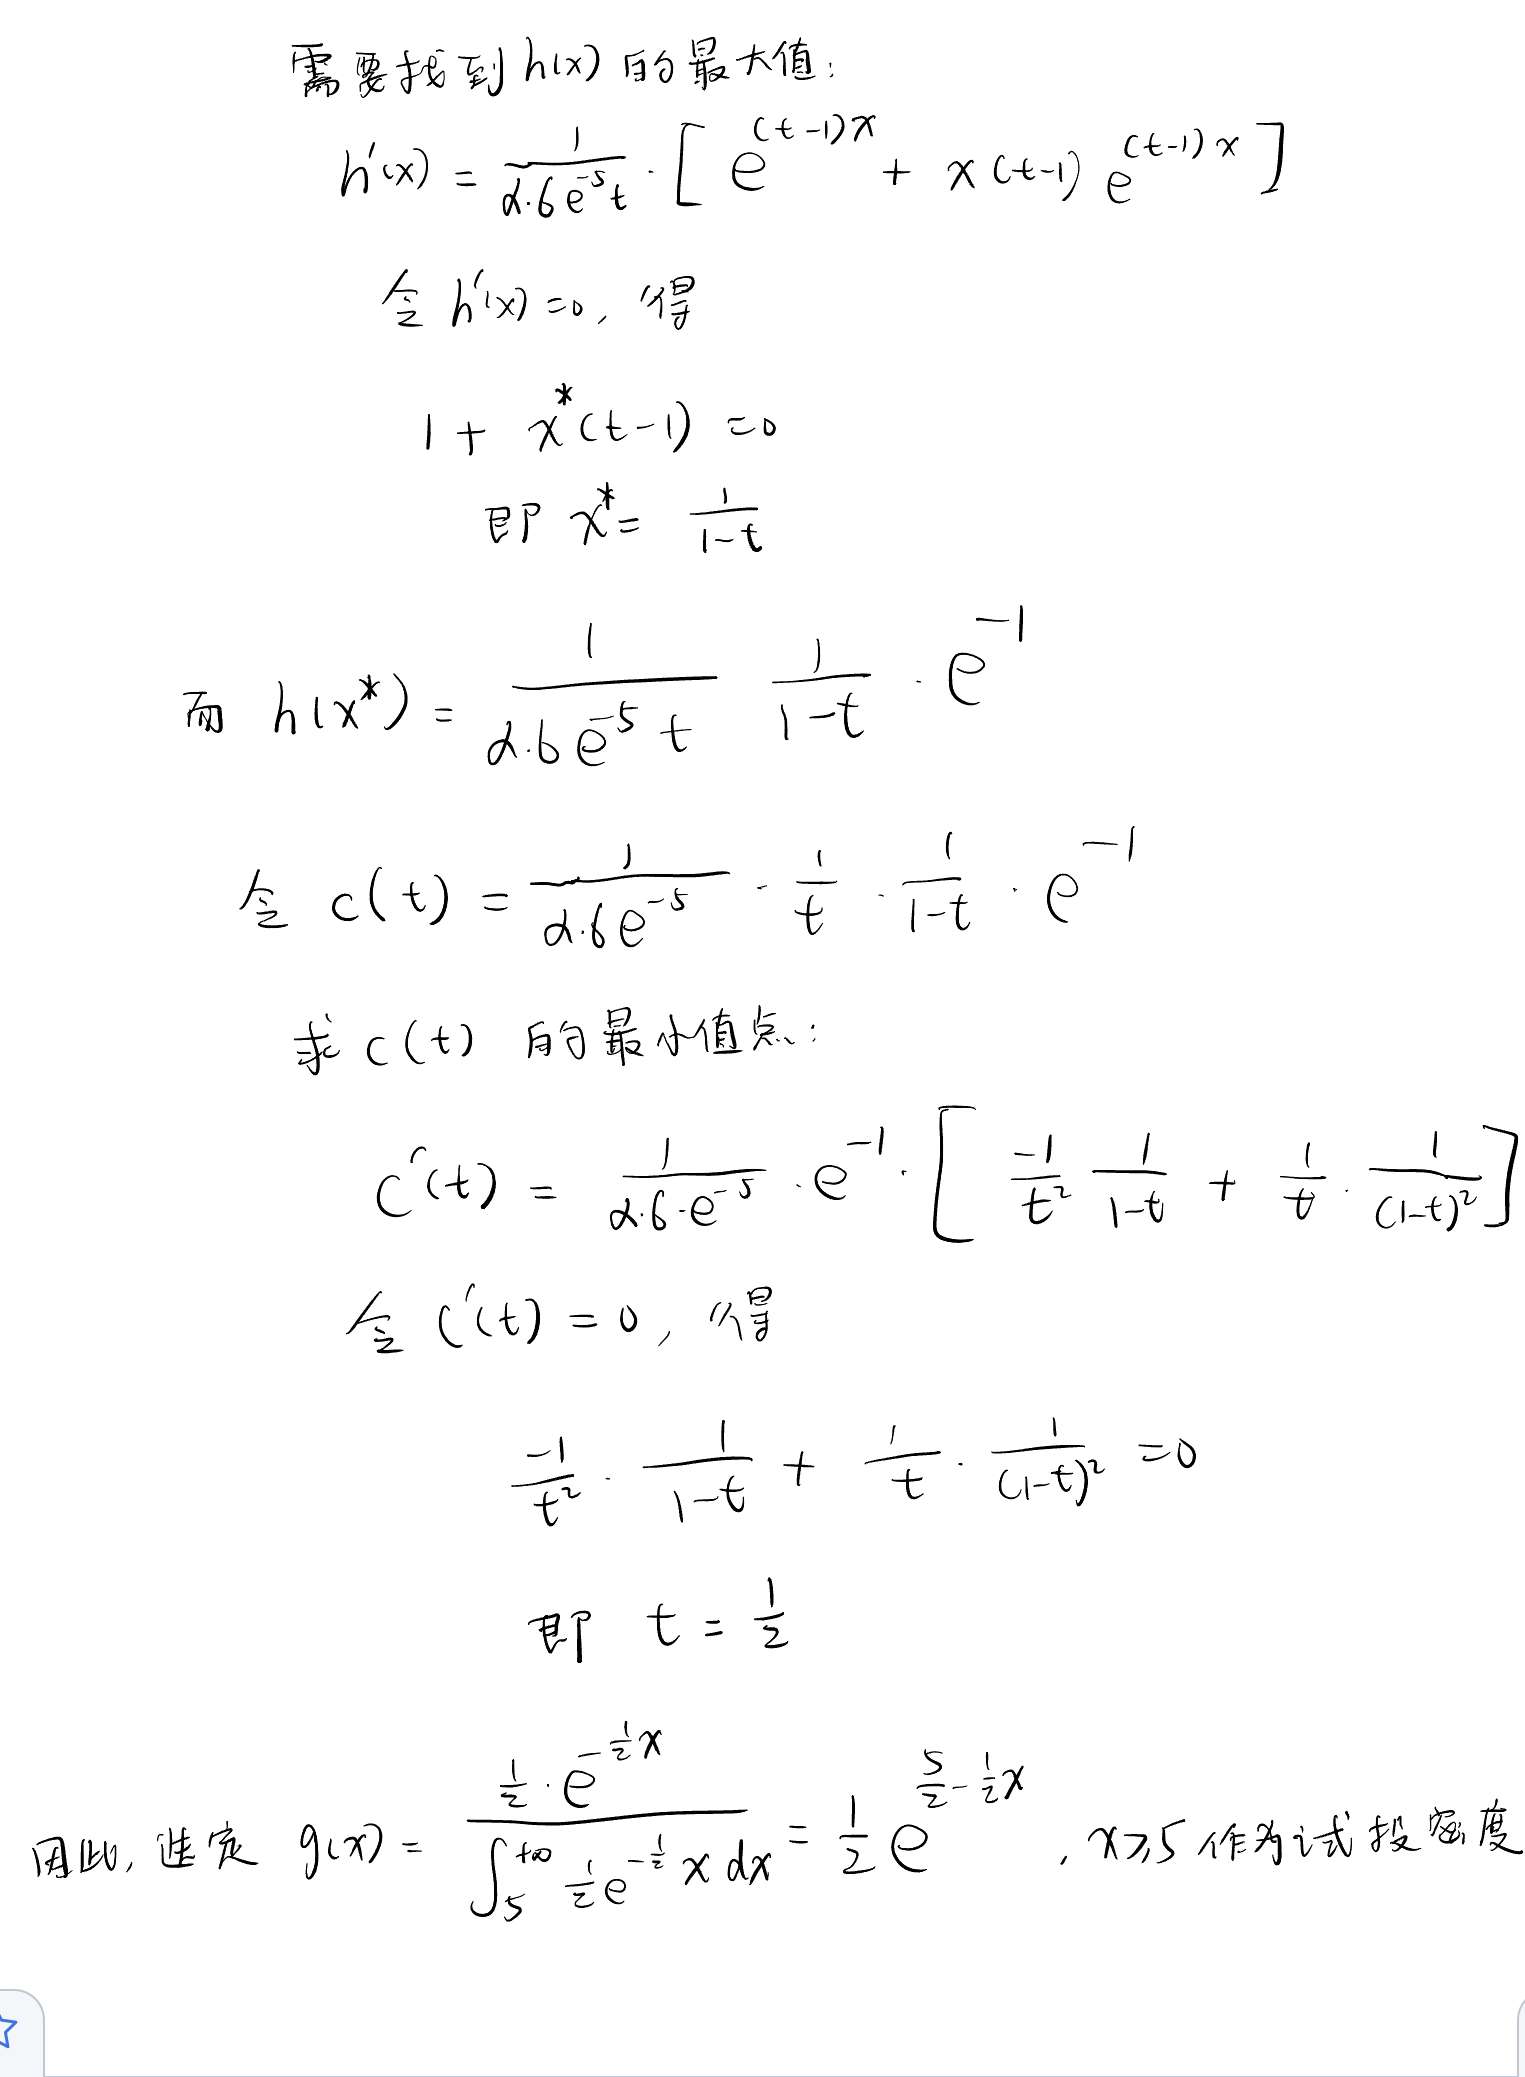
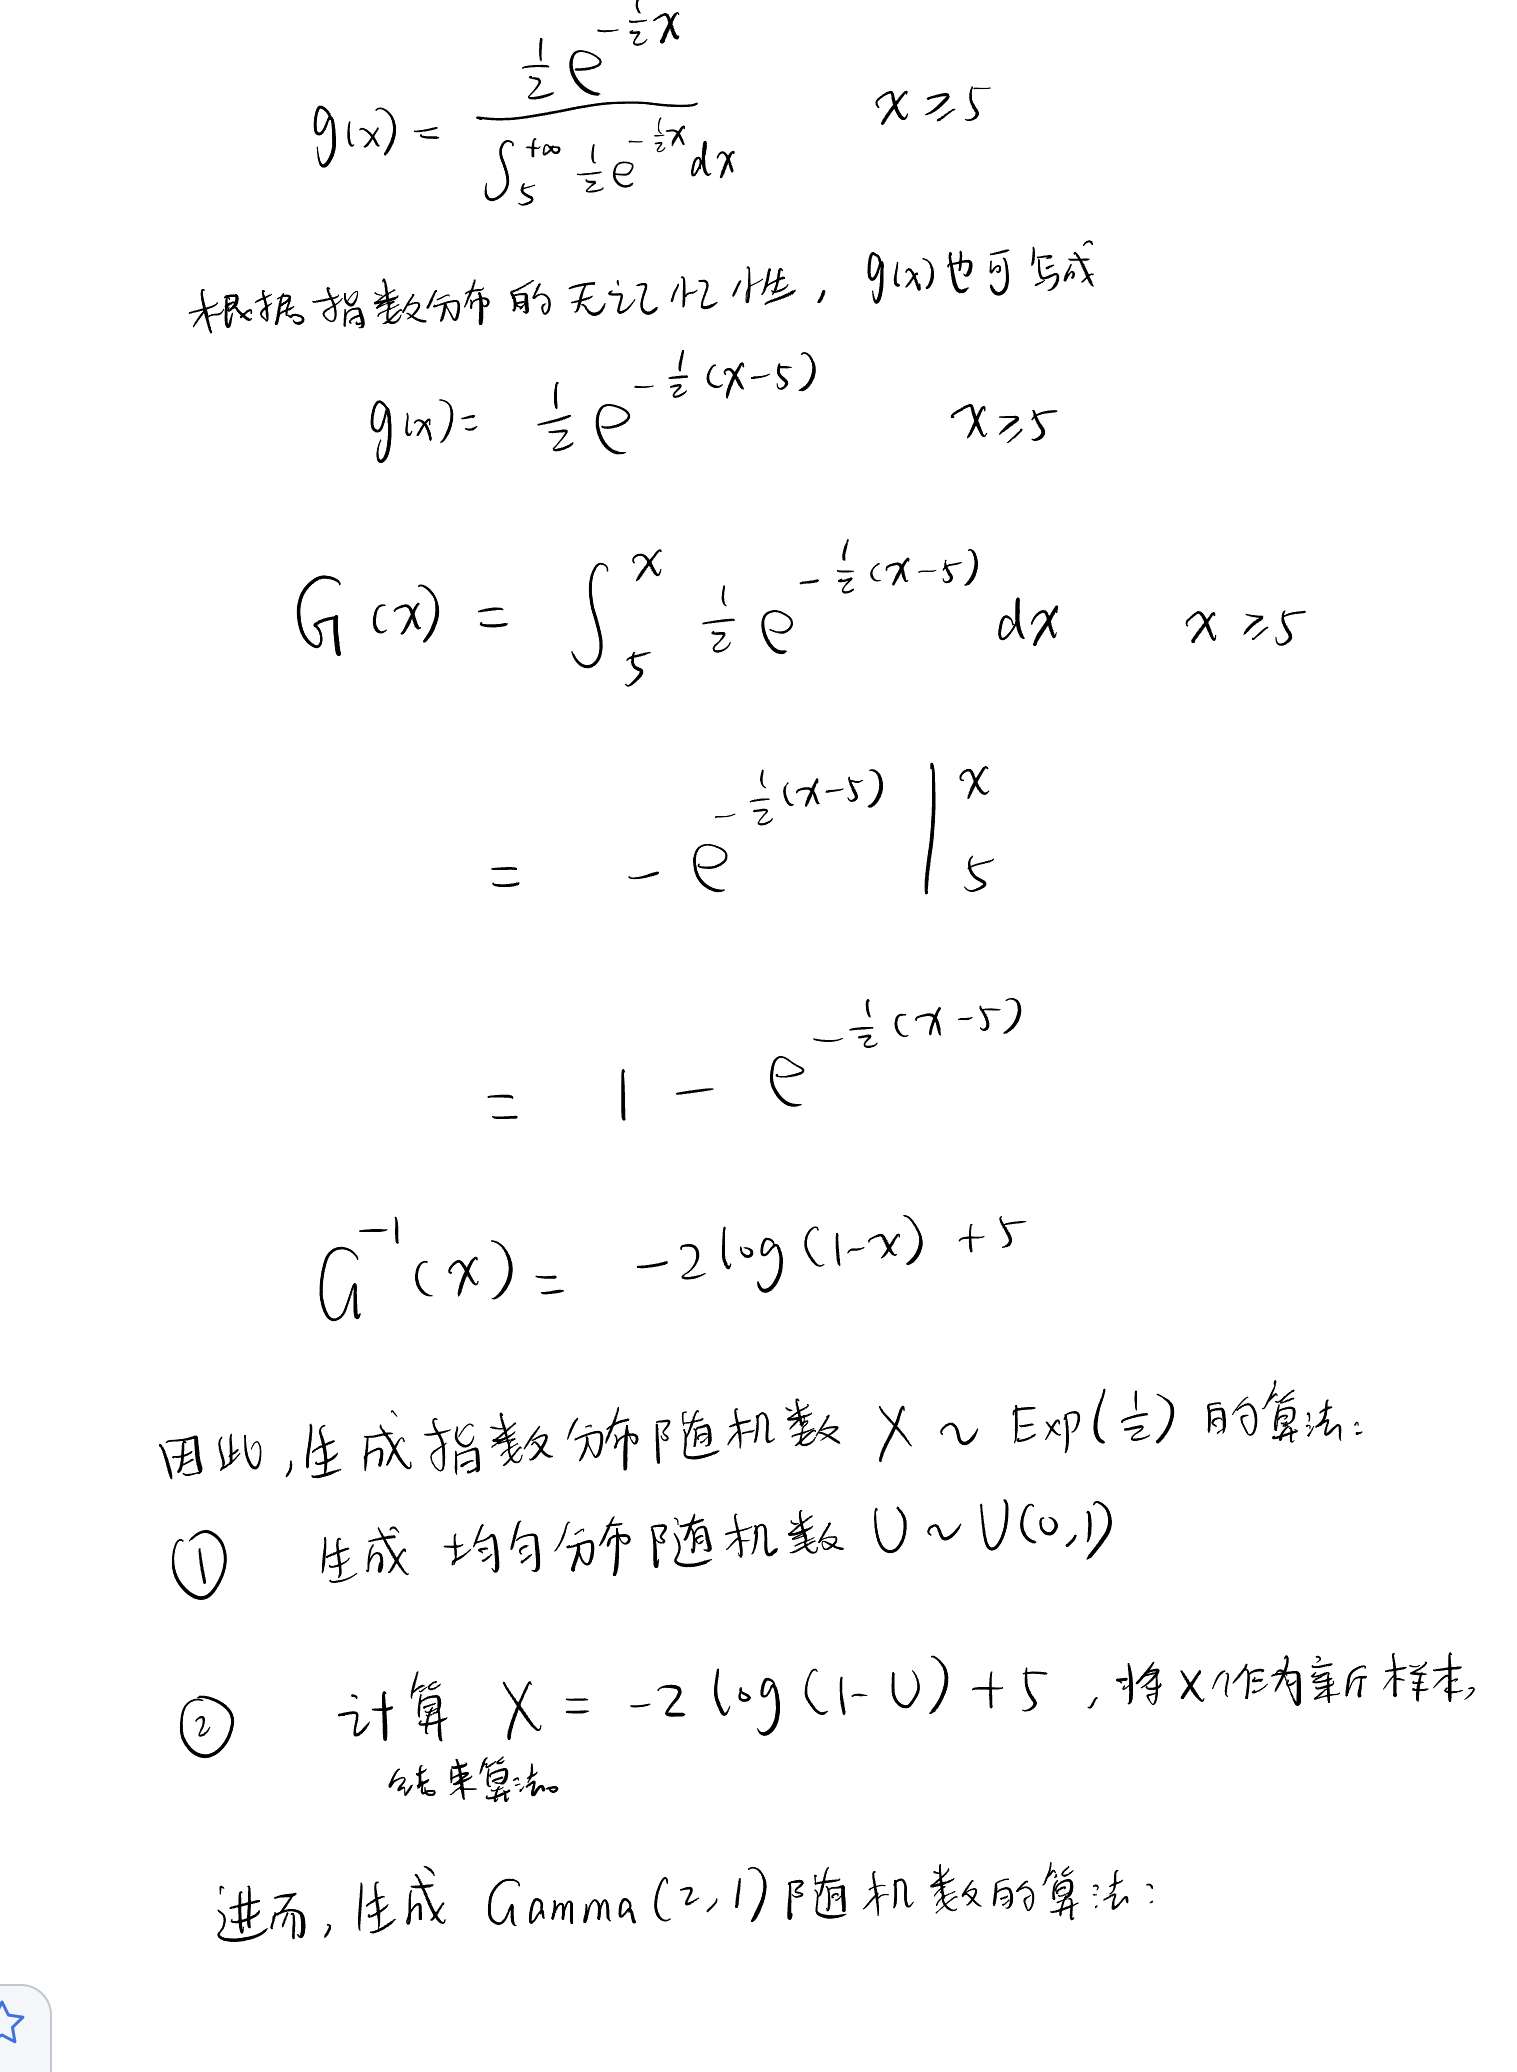
定义函数,生成指数分布随机数
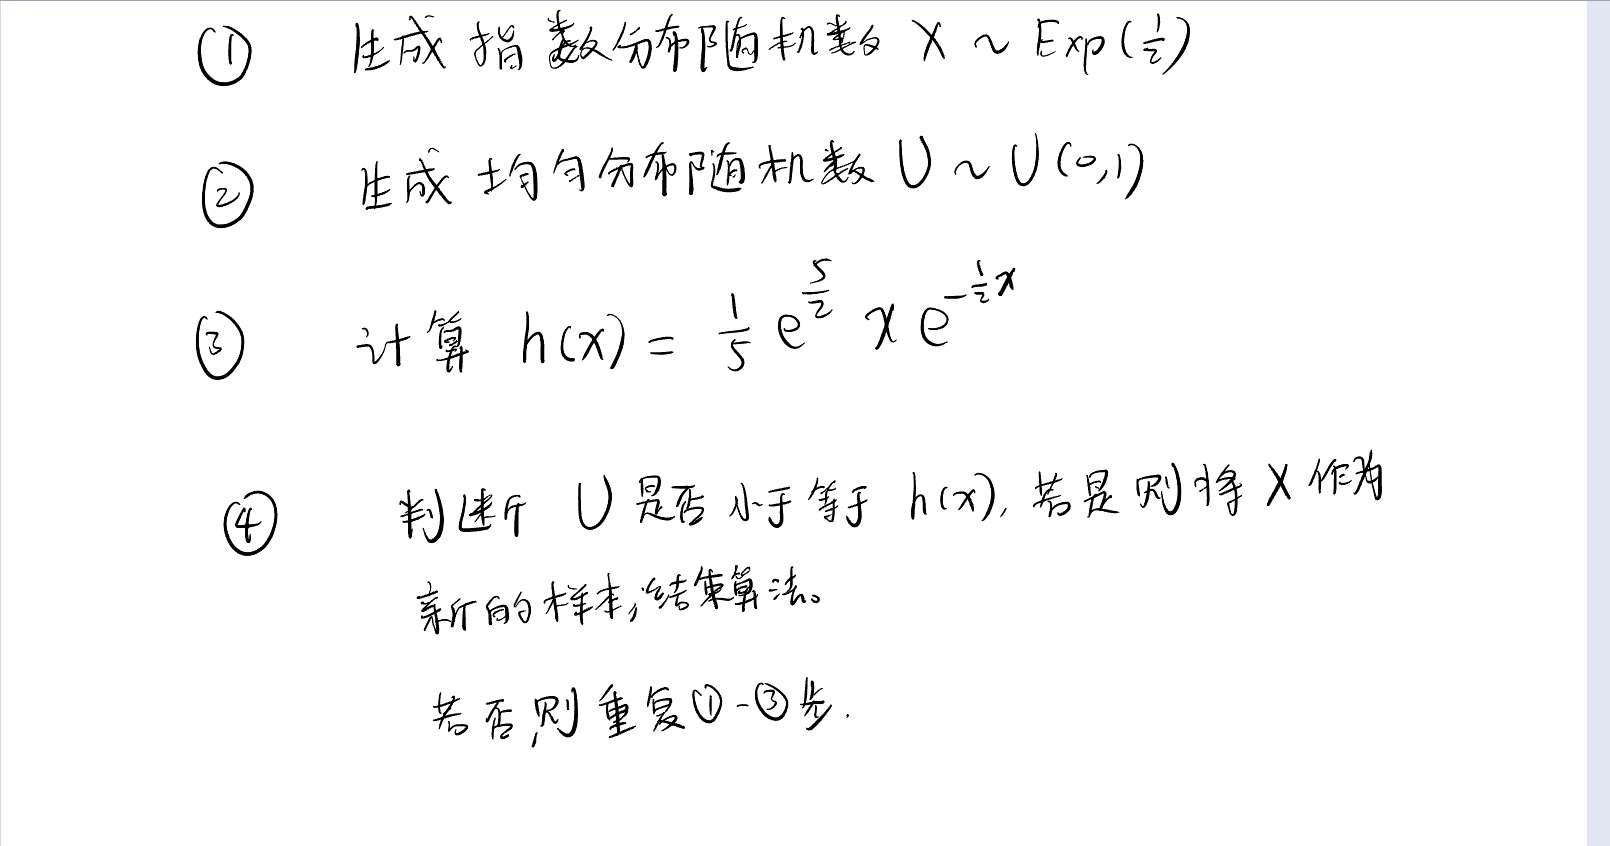
定义函数,生成\(\Gamma\)分布随机数
Python
def rondom_gamma():
    iteration = 0
    while True:
        iteration += 1
        x = rondom_exponential(0.5)
        u = random.uniform(0, 1)
        h_x = (1 / 5) * math.exp((5 - x) / 2) * x
        if u <= h_x:
            return x, iteration
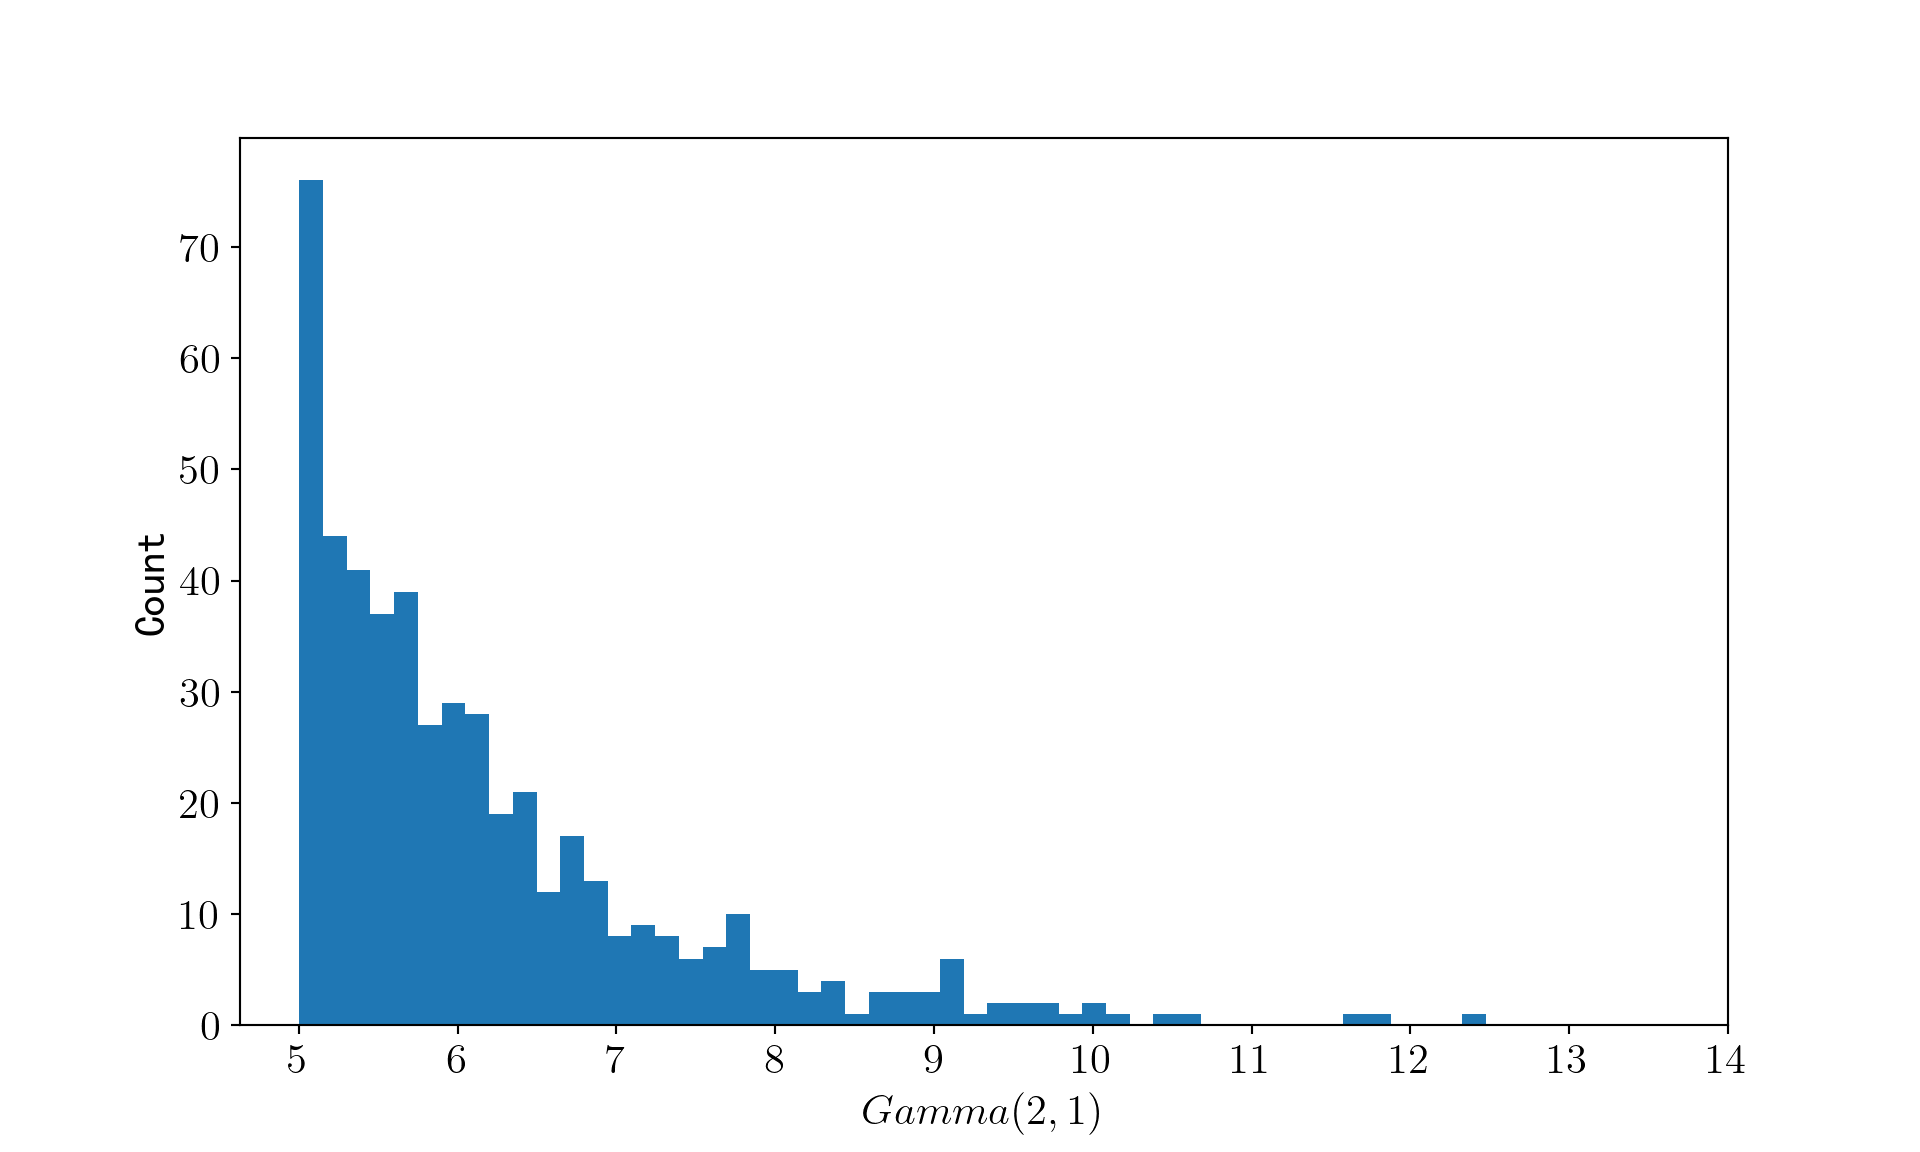
生成取值大于 5 的\(\Gamma(2,1)\)随机数
Python
number_of_random_variavles = 500

alpha = 2
beta = 1

rondom_gamma_list = []
total_iteration = 0
for i in range(number_of_random_variavles):
    rondom_gamma_list.append(rondom_gamma()[0])
    total_iteration += rondom_gamma()[1]
绘制随机数的柱状图
Python
fig = plt.figure(figsize=(10, 6))
ax = fig.add_subplot(111)
ax.hist(rondom_gamma_list, bins=50)
Text Only
## (array([76., 44., 41., 37., 39., 27., 29., 28., 19., 21., 12., 17., 13.,
##         8.,  9.,  8.,  6.,  7., 10.,  5.,  5.,  3.,  4.,  1.,  3.,  3.,
##         3.,  6.,  1.,  2.,  2.,  2.,  1.,  2.,  1.,  0.,  1.,  1.,  0.,
##         0.,  0.,  0.,  0.,  0.,  1.,  1.,  0.,  0.,  0.,  1.]), array([ 5.00354213,  5.15295126,  5.3023604 ,  5.45176953,  5.60117866,
##         5.7505878 ,  5.89999693,  6.04940606,  6.19881519,  6.34822433,
##         6.49763346,  6.64704259,  6.79645172,  6.94586086,  7.09526999,
##         7.24467912,  7.39408825,  7.54349739,  7.69290652,  7.84231565,
##         7.99172479,  8.14113392,  8.29054305,  8.43995218,  8.58936132,
##         8.73877045,  8.88817958,  9.03758871,  9.18699785,  9.33640698,
##         9.48581611,  9.63522524,  9.78463438,  9.93404351, 10.08345264,
##        10.23286177, 10.38227091, 10.53168004, 10.68108917, 10.83049831,
##        10.97990744, 11.12931657, 11.2787257 , 11.42813484, 11.57754397,
##        11.7269531 , 11.87636223, 12.02577137, 12.1751805 , 12.32458963,
##        12.47399876]), <BarContainer object of 50 artists>)
Python
ax.set_xlabel(r"$Gamma(2, 1)$")
# x 轴刻度
ax.set_xticks(np.arange(5, 15, 1))
ax.set_ylabel("Count", usetex=False)